Ethiopian vs Blackfeet Disability Age Under 5
COMPARE
Ethiopian
Blackfeet
Disability Age Under 5
Disability Age Under 5 Comparison
Ethiopians
Blackfeet
1.1%
DISABILITY AGE UNDER 5
97.2/ 100
METRIC RATING
89th/ 347
METRIC RANK
1.6%
DISABILITY AGE UNDER 5
0.0/ 100
METRIC RATING
305th/ 347
METRIC RANK
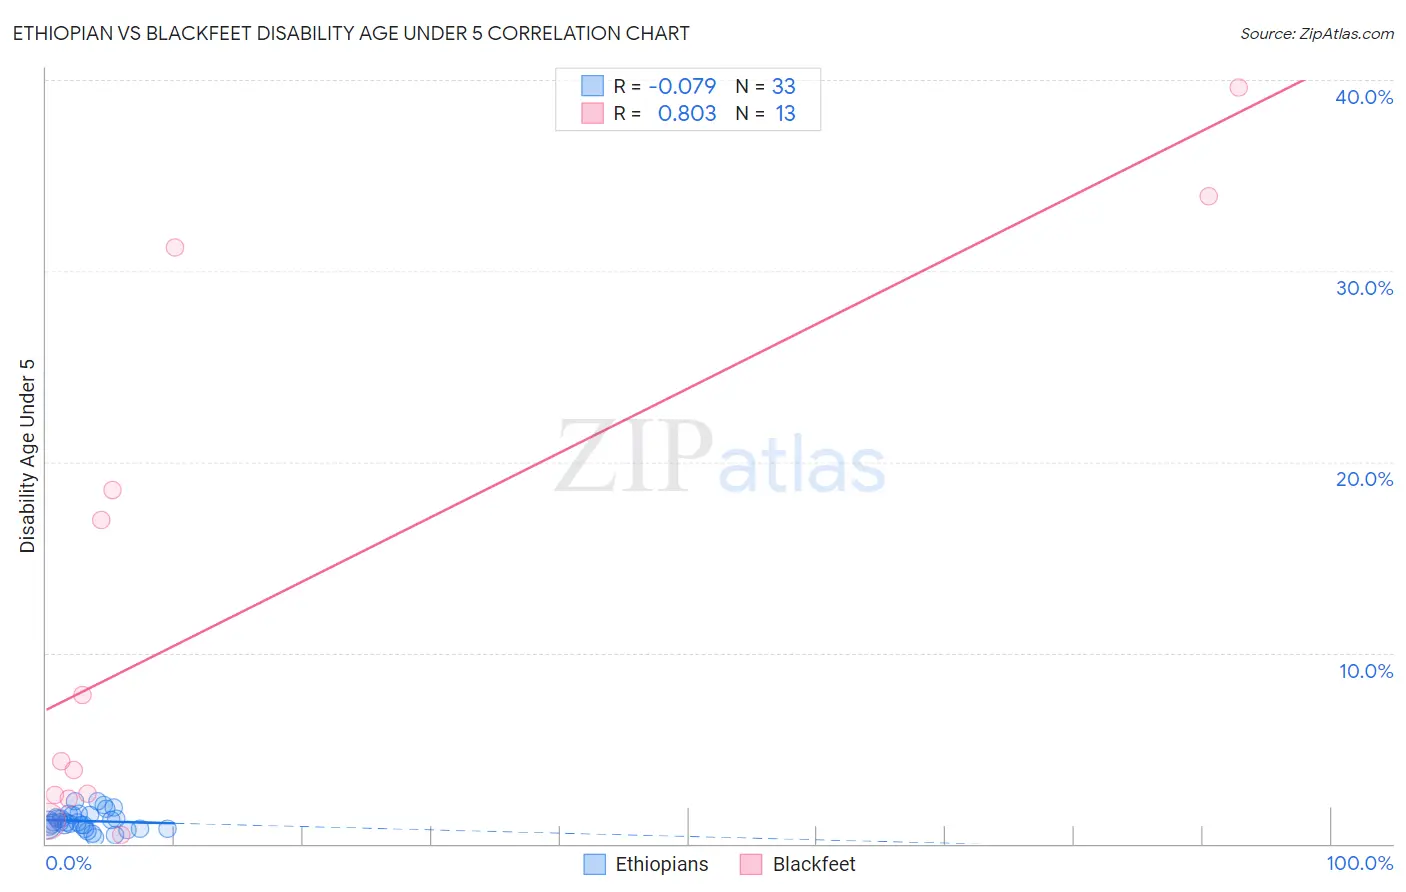
Ethiopian vs Blackfeet Disability Age Under 5 Correlation Chart
The statistical analysis conducted on geographies consisting of 145,731,727 people shows a slight negative correlation between the proportion of Ethiopians and percentage of population with a disability under the age of 5 in the United States with a correlation coefficient (R) of -0.079 and weighted average of 1.1%. Similarly, the statistical analysis conducted on geographies consisting of 184,518,312 people shows a very strong positive correlation between the proportion of Blackfeet and percentage of population with a disability under the age of 5 in the United States with a correlation coefficient (R) of 0.803 and weighted average of 1.6%, a difference of 44.3%.
Disability Age Under 5 Correlation Summary
| Measurement | Ethiopian | Blackfeet |
| Minimum | 0.34% | 0.46% |
| Maximum | 2.3% | 39.6% |
| Range | 1.9% | 39.1% |
| Mean | 1.2% | 12.7% |
| Median | 1.1% | 4.4% |
| Interquartile 25% (IQ1) | 0.88% | 2.4% |
| Interquartile 75% (IQ3) | 1.5% | 24.9% |
| Interquartile Range (IQR) | 0.60% | 22.5% |
| Standard Deviation (Sample) | 0.48% | 14.0% |
| Standard Deviation (Population) | 0.47% | 13.4% |
Similar Demographics by Disability Age Under 5
Demographics Similar to Ethiopians by Disability Age Under 5
In terms of disability age under 5, the demographic groups most similar to Ethiopians are Chinese (1.1%, a difference of 0.030%), Albanian (1.1%, a difference of 0.070%), Immigrants from Cuba (1.1%, a difference of 0.24%), Spanish American (1.1%, a difference of 0.27%), and Immigrants from Dominican Republic (1.1%, a difference of 0.28%).
| Demographics | Rating | Rank | Disability Age Under 5 |
| Immigrants | Jordan | 97.9 /100 | #82 | Exceptional 1.1% |
| Immigrants | Syria | 97.9 /100 | #83 | Exceptional 1.1% |
| Immigrants | Zaire | 97.8 /100 | #84 | Exceptional 1.1% |
| Sudanese | 97.7 /100 | #85 | Exceptional 1.1% |
| Okinawans | 97.6 /100 | #86 | Exceptional 1.1% |
| Ugandans | 97.5 /100 | #87 | Exceptional 1.1% |
| Immigrants | Dominican Republic | 97.5 /100 | #88 | Exceptional 1.1% |
| Ethiopians | 97.2 /100 | #89 | Exceptional 1.1% |
| Chinese | 97.2 /100 | #90 | Exceptional 1.1% |
| Albanians | 97.2 /100 | #91 | Exceptional 1.1% |
| Immigrants | Cuba | 97.0 /100 | #92 | Exceptional 1.1% |
| Spanish Americans | 96.9 /100 | #93 | Exceptional 1.1% |
| Sri Lankans | 96.8 /100 | #94 | Exceptional 1.1% |
| Immigrants | Moldova | 96.8 /100 | #95 | Exceptional 1.1% |
| Mongolians | 96.6 /100 | #96 | Exceptional 1.1% |
Demographics Similar to Blackfeet by Disability Age Under 5
In terms of disability age under 5, the demographic groups most similar to Blackfeet are Creek (1.6%, a difference of 0.040%), Scottish (1.6%, a difference of 0.10%), Seminole (1.6%, a difference of 0.16%), Navajo (1.6%, a difference of 0.25%), and Swiss (1.6%, a difference of 0.79%).
| Demographics | Rating | Rank | Disability Age Under 5 |
| Cajuns | 0.0 /100 | #298 | Tragic 1.6% |
| Portuguese | 0.0 /100 | #299 | Tragic 1.6% |
| Shoshone | 0.0 /100 | #300 | Tragic 1.6% |
| German Russians | 0.0 /100 | #301 | Tragic 1.6% |
| Welsh | 0.0 /100 | #302 | Tragic 1.6% |
| Swiss | 0.0 /100 | #303 | Tragic 1.6% |
| Seminole | 0.0 /100 | #304 | Tragic 1.6% |
| Blackfeet | 0.0 /100 | #305 | Tragic 1.6% |
| Creek | 0.0 /100 | #306 | Tragic 1.6% |
| Scottish | 0.0 /100 | #307 | Tragic 1.6% |
| Navajo | 0.0 /100 | #308 | Tragic 1.6% |
| Cape Verdeans | 0.0 /100 | #309 | Tragic 1.7% |
| Whites/Caucasians | 0.0 /100 | #310 | Tragic 1.7% |
| English | 0.0 /100 | #311 | Tragic 1.7% |
| Puerto Ricans | 0.0 /100 | #312 | Tragic 1.7% |