Immigrants from Nepal vs Aleut Disability Age Under 5
COMPARE
Immigrants from Nepal
Aleut
Disability Age Under 5
Disability Age Under 5 Comparison
Immigrants from Nepal
Aleuts
1.0%
DISABILITY AGE UNDER 5
99.9/ 100
METRIC RATING
36th/ 347
METRIC RANK
1.2%
DISABILITY AGE UNDER 5
90.7/ 100
METRIC RATING
122nd/ 347
METRIC RANK
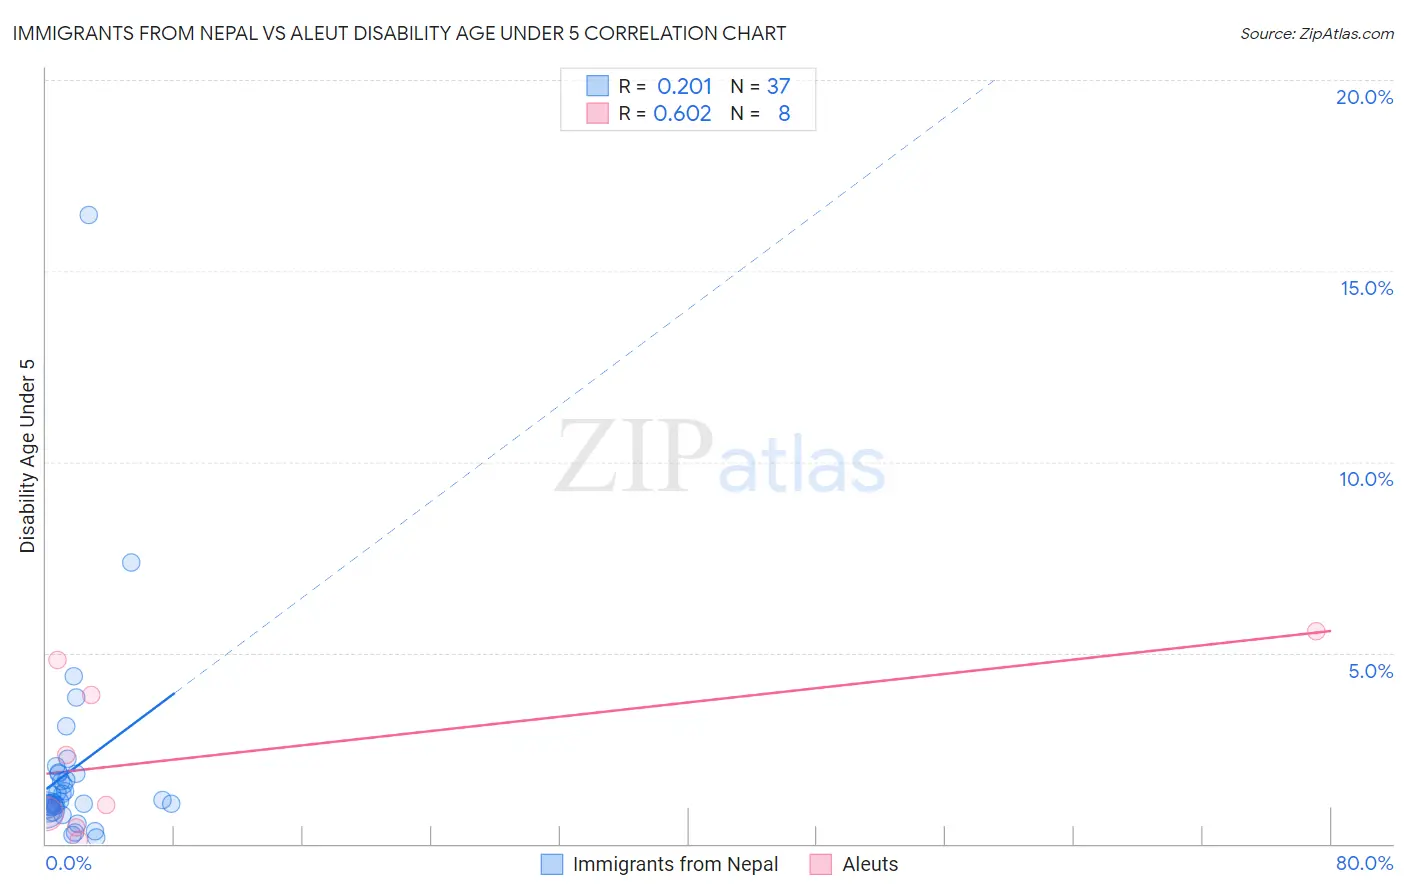
Immigrants from Nepal vs Aleut Disability Age Under 5 Correlation Chart
The statistical analysis conducted on geographies consisting of 121,153,865 people shows a weak positive correlation between the proportion of Immigrants from Nepal and percentage of population with a disability under the age of 5 in the United States with a correlation coefficient (R) of 0.201 and weighted average of 1.0%. Similarly, the statistical analysis conducted on geographies consisting of 51,541,789 people shows a significant positive correlation between the proportion of Aleuts and percentage of population with a disability under the age of 5 in the United States with a correlation coefficient (R) of 0.602 and weighted average of 1.2%, a difference of 12.6%.
Disability Age Under 5 Correlation Summary
| Measurement | Immigrants from Nepal | Aleut |
| Minimum | 0.17% | 0.11% |
| Maximum | 16.5% | 5.6% |
| Range | 16.3% | 5.4% |
| Mean | 1.9% | 2.4% |
| Median | 1.1% | 1.7% |
| Interquartile 25% (IQ1) | 0.92% | 0.61% |
| Interquartile 75% (IQ3) | 1.8% | 4.4% |
| Interquartile Range (IQR) | 0.92% | 3.7% |
| Standard Deviation (Sample) | 2.8% | 2.1% |
| Standard Deviation (Population) | 2.8% | 2.0% |
Similar Demographics by Disability Age Under 5
Demographics Similar to Immigrants from Nepal by Disability Age Under 5
In terms of disability age under 5, the demographic groups most similar to Immigrants from Nepal are Immigrants from India (1.0%, a difference of 0.020%), Immigrants from Guyana (1.0%, a difference of 0.11%), Barbadian (1.0%, a difference of 0.71%), Filipino (1.1%, a difference of 0.78%), and Immigrants from Ukraine (1.0%, a difference of 0.95%).
| Demographics | Rating | Rank | Disability Age Under 5 |
| Immigrants | Belarus | 100.0 /100 | #29 | Exceptional 1.0% |
| Immigrants | South Central Asia | 99.9 /100 | #30 | Exceptional 1.0% |
| Armenians | 99.9 /100 | #31 | Exceptional 1.0% |
| Iranians | 99.9 /100 | #32 | Exceptional 1.0% |
| Bolivians | 99.9 /100 | #33 | Exceptional 1.0% |
| Immigrants | Ukraine | 99.9 /100 | #34 | Exceptional 1.0% |
| Barbadians | 99.9 /100 | #35 | Exceptional 1.0% |
| Immigrants | Nepal | 99.9 /100 | #36 | Exceptional 1.0% |
| Immigrants | India | 99.9 /100 | #37 | Exceptional 1.0% |
| Immigrants | Guyana | 99.9 /100 | #38 | Exceptional 1.0% |
| Filipinos | 99.9 /100 | #39 | Exceptional 1.1% |
| Immigrants | Albania | 99.9 /100 | #40 | Exceptional 1.1% |
| Thais | 99.8 /100 | #41 | Exceptional 1.1% |
| Immigrants | Bulgaria | 99.8 /100 | #42 | Exceptional 1.1% |
| Pima | 99.8 /100 | #43 | Exceptional 1.1% |
Demographics Similar to Aleuts by Disability Age Under 5
In terms of disability age under 5, the demographic groups most similar to Aleuts are Zimbabwean (1.2%, a difference of 0.050%), Immigrants from Cambodia (1.2%, a difference of 0.070%), Japanese (1.2%, a difference of 0.13%), Immigrants from Senegal (1.2%, a difference of 0.19%), and Central American (1.2%, a difference of 0.29%).
| Demographics | Rating | Rank | Disability Age Under 5 |
| Immigrants | Caribbean | 93.8 /100 | #115 | Exceptional 1.2% |
| Immigrants | Northern Africa | 93.8 /100 | #116 | Exceptional 1.2% |
| Immigrants | Philippines | 93.5 /100 | #117 | Exceptional 1.2% |
| Immigrants | Venezuela | 93.4 /100 | #118 | Exceptional 1.2% |
| Bhutanese | 92.5 /100 | #119 | Exceptional 1.2% |
| Immigrants | Eritrea | 92.3 /100 | #120 | Exceptional 1.2% |
| Immigrants | Senegal | 91.4 /100 | #121 | Exceptional 1.2% |
| Aleuts | 90.7 /100 | #122 | Exceptional 1.2% |
| Zimbabweans | 90.6 /100 | #123 | Exceptional 1.2% |
| Immigrants | Cambodia | 90.5 /100 | #124 | Exceptional 1.2% |
| Japanese | 90.3 /100 | #125 | Exceptional 1.2% |
| Central Americans | 89.7 /100 | #126 | Excellent 1.2% |
| Immigrants | Romania | 88.4 /100 | #127 | Excellent 1.2% |
| Immigrants | France | 88.4 /100 | #128 | Excellent 1.2% |
| Immigrants | Immigrants | 88.0 /100 | #129 | Excellent 1.2% |