Immigrants from Nepal vs Blackfeet 11th Grade
COMPARE
Immigrants from Nepal
Blackfeet
11th Grade
11th Grade Comparison
Immigrants from Nepal
Blackfeet
92.4%
11TH GRADE
36.4/ 100
METRIC RATING
185th/ 347
METRIC RANK
92.0%
11TH GRADE
10.1/ 100
METRIC RATING
218th/ 347
METRIC RANK
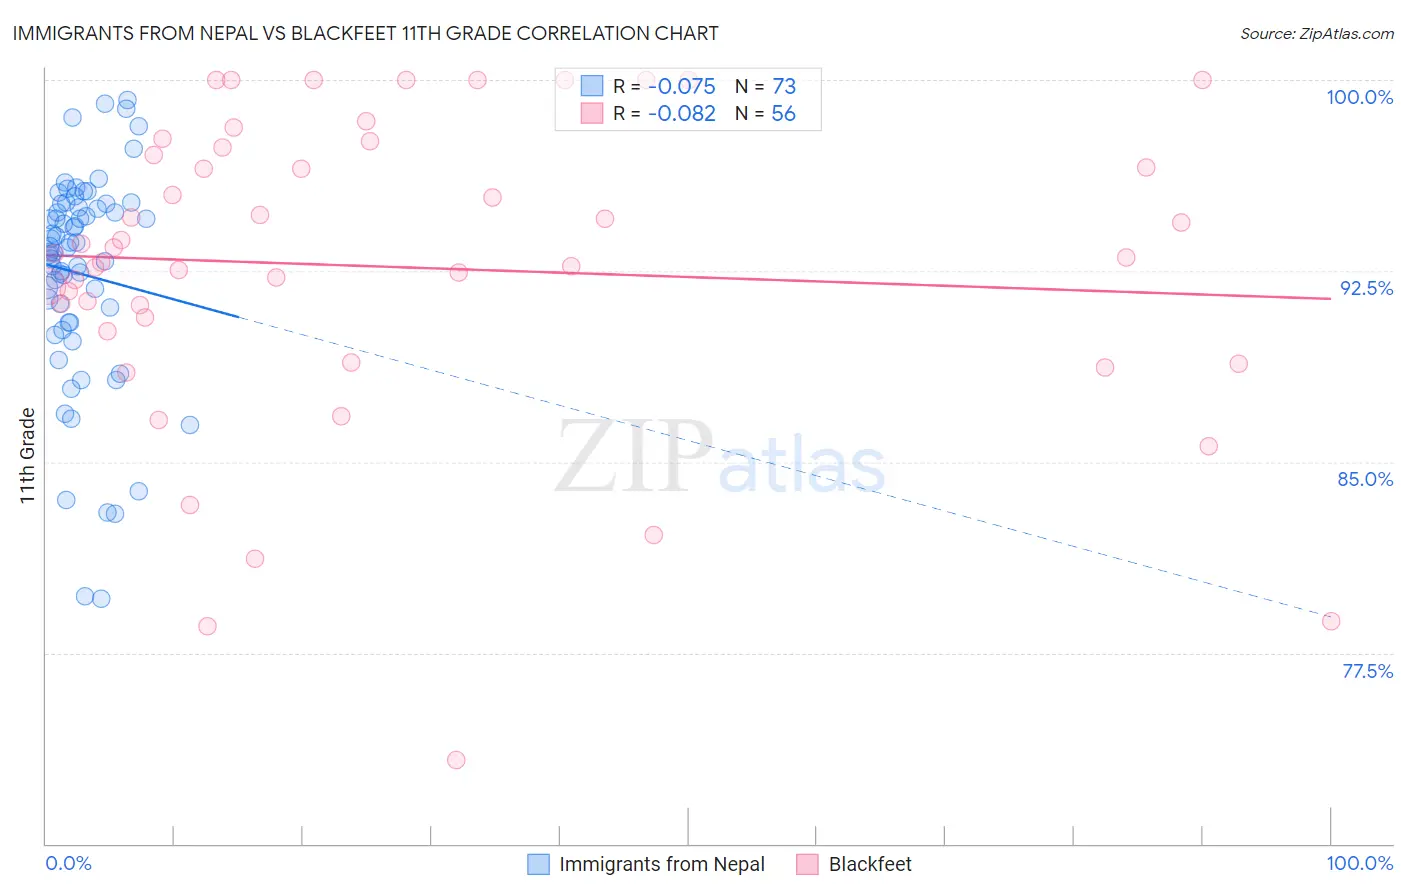
Immigrants from Nepal vs Blackfeet 11th Grade Correlation Chart
The statistical analysis conducted on geographies consisting of 186,780,807 people shows a slight negative correlation between the proportion of Immigrants from Nepal and percentage of population with at least 11th grade education in the United States with a correlation coefficient (R) of -0.075 and weighted average of 92.4%. Similarly, the statistical analysis conducted on geographies consisting of 309,582,133 people shows a slight negative correlation between the proportion of Blackfeet and percentage of population with at least 11th grade education in the United States with a correlation coefficient (R) of -0.082 and weighted average of 92.0%, a difference of 0.40%.
11th Grade Correlation Summary
| Measurement | Immigrants from Nepal | Blackfeet |
| Minimum | 79.6% | 73.3% |
| Maximum | 99.2% | 100.0% |
| Range | 19.6% | 26.7% |
| Mean | 92.4% | 92.7% |
| Median | 93.4% | 93.1% |
| Interquartile 25% (IQ1) | 90.5% | 90.4% |
| Interquartile 75% (IQ3) | 95.1% | 97.2% |
| Interquartile Range (IQR) | 4.6% | 6.8% |
| Standard Deviation (Sample) | 4.2% | 6.1% |
| Standard Deviation (Population) | 4.2% | 6.0% |
Similar Demographics by 11th Grade
Demographics Similar to Immigrants from Nepal by 11th Grade
In terms of 11th grade, the demographic groups most similar to Immigrants from Nepal are Immigrants from Malaysia (92.4%, a difference of 0.010%), Immigrants from Asia (92.4%, a difference of 0.010%), Arapaho (92.4%, a difference of 0.010%), Immigrants from Morocco (92.4%, a difference of 0.020%), and Immigrants from Western Asia (92.4%, a difference of 0.020%).
| Demographics | Rating | Rank | 11th Grade |
| Sudanese | 43.4 /100 | #178 | Average 92.5% |
| Creek | 40.9 /100 | #179 | Average 92.4% |
| Inupiat | 40.7 /100 | #180 | Average 92.4% |
| Cherokee | 40.7 /100 | #181 | Average 92.4% |
| Immigrants | Morocco | 38.6 /100 | #182 | Fair 92.4% |
| Immigrants | Malaysia | 37.6 /100 | #183 | Fair 92.4% |
| Immigrants | Asia | 37.4 /100 | #184 | Fair 92.4% |
| Immigrants | Nepal | 36.4 /100 | #185 | Fair 92.4% |
| Arapaho | 35.1 /100 | #186 | Fair 92.4% |
| Immigrants | Western Asia | 35.0 /100 | #187 | Fair 92.4% |
| Immigrants | Indonesia | 33.7 /100 | #188 | Fair 92.4% |
| Immigrants | Chile | 33.3 /100 | #189 | Fair 92.4% |
| Chickasaw | 31.4 /100 | #190 | Fair 92.3% |
| French American Indians | 30.8 /100 | #191 | Fair 92.3% |
| Immigrants | Syria | 30.4 /100 | #192 | Fair 92.3% |
Demographics Similar to Blackfeet by 11th Grade
In terms of 11th grade, the demographic groups most similar to Blackfeet are Portuguese (92.0%, a difference of 0.0%), Immigrants from Sierra Leone (92.0%, a difference of 0.030%), Somali (92.1%, a difference of 0.040%), Immigrants from Southern Europe (92.1%, a difference of 0.060%), and Afghan (92.1%, a difference of 0.070%).
| Demographics | Rating | Rank | 11th Grade |
| Immigrants | Micronesia | 17.7 /100 | #211 | Poor 92.2% |
| Koreans | 14.4 /100 | #212 | Poor 92.1% |
| Immigrants | Ethiopia | 13.9 /100 | #213 | Poor 92.1% |
| Afghans | 12.8 /100 | #214 | Poor 92.1% |
| Immigrants | Southern Europe | 12.5 /100 | #215 | Poor 92.1% |
| Somalis | 11.6 /100 | #216 | Poor 92.1% |
| Immigrants | Sierra Leone | 11.1 /100 | #217 | Poor 92.0% |
| Blackfeet | 10.1 /100 | #218 | Poor 92.0% |
| Portuguese | 10.0 /100 | #219 | Tragic 92.0% |
| South American Indians | 7.6 /100 | #220 | Tragic 92.0% |
| Immigrants | Liberia | 7.0 /100 | #221 | Tragic 91.9% |
| Immigrants | Africa | 6.5 /100 | #222 | Tragic 91.9% |
| Immigrants | Bahamas | 6.5 /100 | #223 | Tragic 91.9% |
| Costa Ricans | 6.3 /100 | #224 | Tragic 91.9% |
| Immigrants | Zaire | 5.4 /100 | #225 | Tragic 91.9% |