Immigrants from Nepal vs Blackfeet 9th Grade
COMPARE
Immigrants from Nepal
Blackfeet
9th Grade
9th Grade Comparison
Immigrants from Nepal
Blackfeet
94.8%
9TH GRADE
39.7/ 100
METRIC RATING
183rd/ 347
METRIC RANK
95.0%
9TH GRADE
62.6/ 100
METRIC RATING
165th/ 347
METRIC RANK
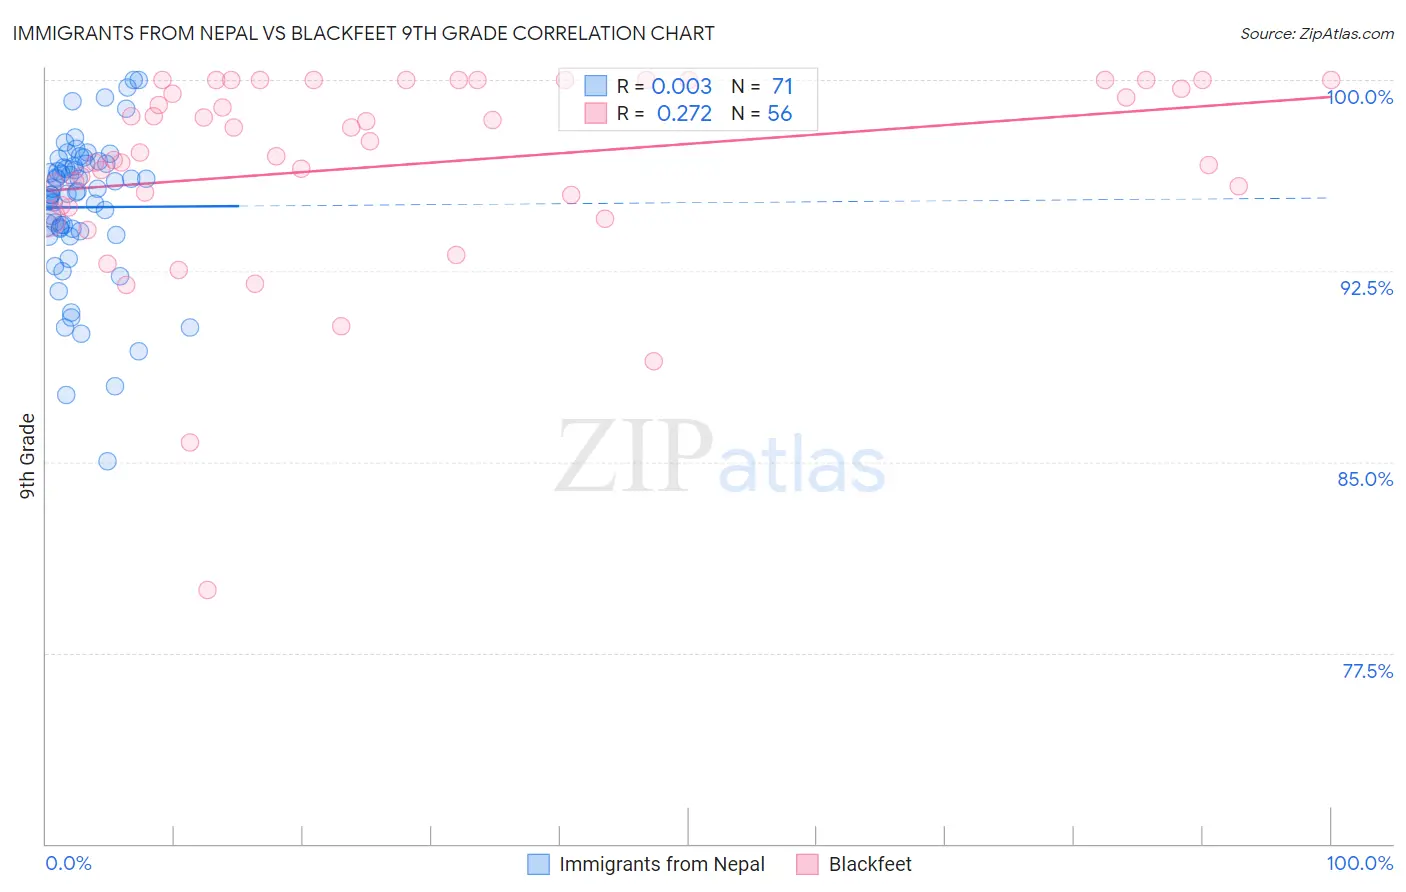
Immigrants from Nepal vs Blackfeet 9th Grade Correlation Chart
The statistical analysis conducted on geographies consisting of 186,636,986 people shows no correlation between the proportion of Immigrants from Nepal and percentage of population with at least 9th grade education in the United States with a correlation coefficient (R) of 0.003 and weighted average of 94.8%. Similarly, the statistical analysis conducted on geographies consisting of 309,582,133 people shows a weak positive correlation between the proportion of Blackfeet and percentage of population with at least 9th grade education in the United States with a correlation coefficient (R) of 0.272 and weighted average of 95.0%, a difference of 0.17%.
9th Grade Correlation Summary
| Measurement | Immigrants from Nepal | Blackfeet |
| Minimum | 85.0% | 80.0% |
| Maximum | 100.0% | 100.0% |
| Range | 15.0% | 20.0% |
| Mean | 95.0% | 96.7% |
| Median | 95.6% | 97.4% |
| Interquartile 25% (IQ1) | 94.0% | 95.3% |
| Interquartile 75% (IQ3) | 96.7% | 100.0% |
| Interquartile Range (IQR) | 2.7% | 4.7% |
| Standard Deviation (Sample) | 2.9% | 3.9% |
| Standard Deviation (Population) | 2.9% | 3.9% |
Demographics Similar to Immigrants from Nepal and Blackfeet by 9th Grade
In terms of 9th grade, the demographic groups most similar to Immigrants from Nepal are Sierra Leonean (94.8%, a difference of 0.020%), Seminole (94.8%, a difference of 0.020%), Argentinean (94.8%, a difference of 0.020%), Immigrants from Uganda (94.8%, a difference of 0.030%), and Immigrants from Poland (94.9%, a difference of 0.050%). Similarly, the demographic groups most similar to Blackfeet are Ute (95.0%, a difference of 0.0%), Venezuelan (95.0%, a difference of 0.010%), Immigrants from Brazil (95.0%, a difference of 0.010%), Chilean (95.0%, a difference of 0.020%), and Spaniard (94.9%, a difference of 0.020%).
| Demographics | Rating | Rank | 9th Grade |
| Venezuelans | 63.6 /100 | #164 | Good 95.0% |
| Blackfeet | 62.6 /100 | #165 | Good 95.0% |
| Ute | 62.6 /100 | #166 | Good 95.0% |
| Immigrants | Brazil | 61.1 /100 | #167 | Good 95.0% |
| Chileans | 60.7 /100 | #168 | Good 95.0% |
| Spaniards | 59.6 /100 | #169 | Average 94.9% |
| Alsatians | 58.6 /100 | #170 | Average 94.9% |
| Colville | 58.5 /100 | #171 | Average 94.9% |
| Iraqis | 54.0 /100 | #172 | Average 94.9% |
| Cheyenne | 51.5 /100 | #173 | Average 94.9% |
| Immigrants | Egypt | 50.0 /100 | #174 | Average 94.9% |
| Brazilians | 49.8 /100 | #175 | Average 94.9% |
| Immigrants | Spain | 49.1 /100 | #176 | Average 94.9% |
| Immigrants | Iraq | 47.8 /100 | #177 | Average 94.9% |
| Immigrants | Poland | 46.7 /100 | #178 | Average 94.9% |
| Immigrants | Venezuela | 46.5 /100 | #179 | Average 94.9% |
| Immigrants | Uganda | 43.1 /100 | #180 | Average 94.8% |
| Sierra Leoneans | 42.7 /100 | #181 | Average 94.8% |
| Seminole | 42.5 /100 | #182 | Average 94.8% |
| Immigrants | Nepal | 39.7 /100 | #183 | Fair 94.8% |
| Argentineans | 37.6 /100 | #184 | Fair 94.8% |