Cape Verdean vs Immigrants from Portugal Disability
COMPARE
Cape Verdean
Immigrants from Portugal
Disability
Disability Comparison
Cape Verdeans
Immigrants from Portugal
13.5%
DISABILITY
0.0/ 100
METRIC RATING
306th/ 347
METRIC RANK
12.9%
DISABILITY
0.0/ 100
METRIC RATING
281st/ 347
METRIC RANK
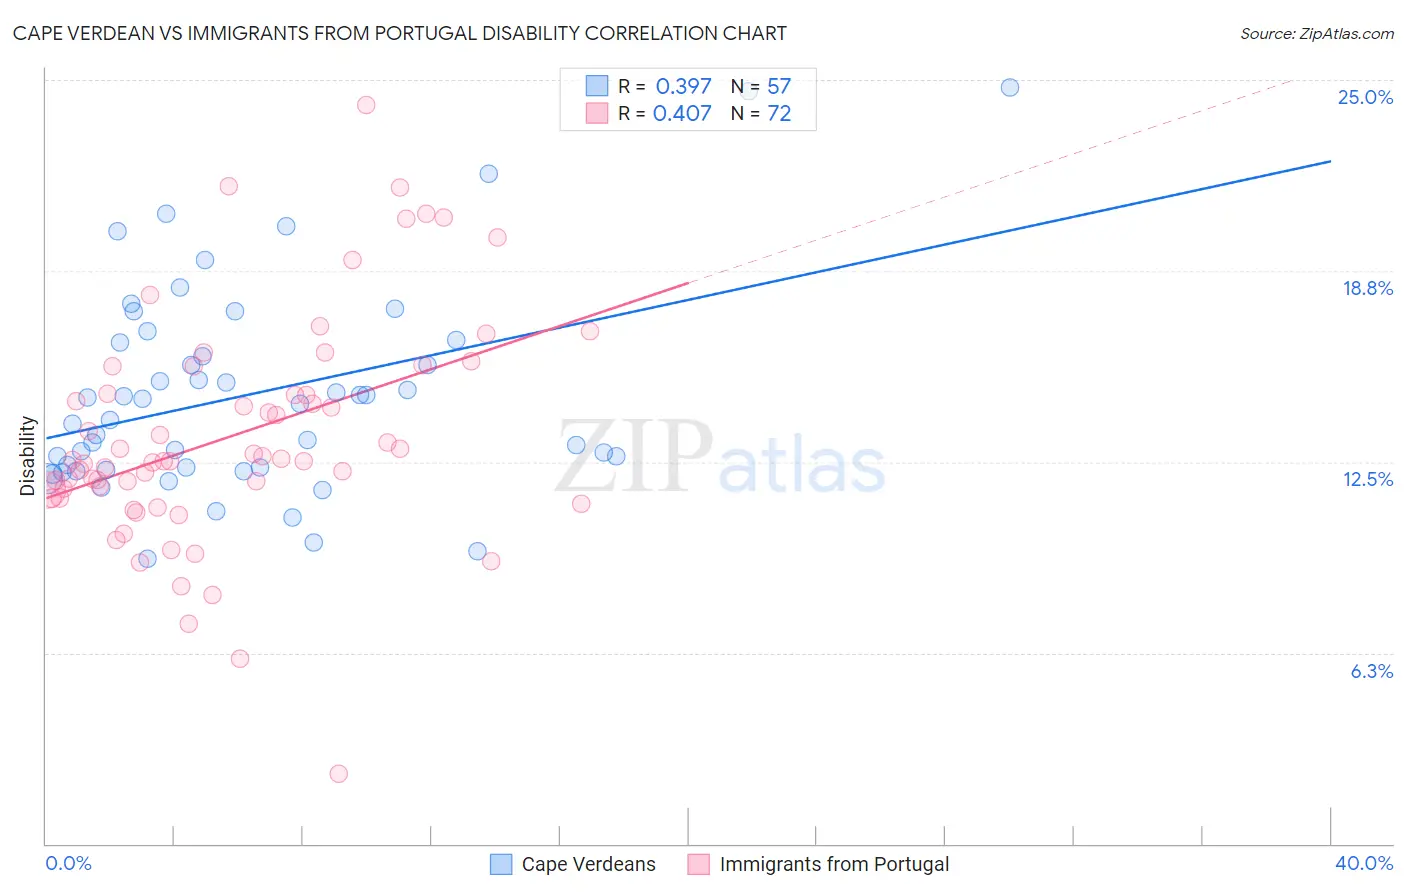
Cape Verdean vs Immigrants from Portugal Disability Correlation Chart
The statistical analysis conducted on geographies consisting of 107,573,874 people shows a mild positive correlation between the proportion of Cape Verdeans and percentage of population with a disability in the United States with a correlation coefficient (R) of 0.397 and weighted average of 13.5%. Similarly, the statistical analysis conducted on geographies consisting of 174,786,483 people shows a moderate positive correlation between the proportion of Immigrants from Portugal and percentage of population with a disability in the United States with a correlation coefficient (R) of 0.407 and weighted average of 12.9%, a difference of 5.0%.
Disability Correlation Summary
| Measurement | Cape Verdean | Immigrants from Portugal |
| Minimum | 9.3% | 2.3% |
| Maximum | 24.7% | 24.2% |
| Range | 15.4% | 21.9% |
| Mean | 14.7% | 13.4% |
| Median | 14.4% | 12.6% |
| Interquartile 25% (IQ1) | 12.3% | 11.4% |
| Interquartile 75% (IQ3) | 16.5% | 15.2% |
| Interquartile Range (IQR) | 4.2% | 3.7% |
| Standard Deviation (Sample) | 3.4% | 3.8% |
| Standard Deviation (Population) | 3.4% | 3.7% |
Similar Demographics by Disability
Demographics Similar to Cape Verdeans by Disability
In terms of disability, the demographic groups most similar to Cape Verdeans are Shoshone (13.5%, a difference of 0.050%), French American Indian (13.5%, a difference of 0.14%), Tlingit-Haida (13.5%, a difference of 0.23%), French Canadian (13.4%, a difference of 0.61%), and Blackfeet (13.6%, a difference of 0.76%).
| Demographics | Rating | Rank | Disability |
| French | 0.0 /100 | #299 | Tragic 13.2% |
| Pennsylvania Germans | 0.0 /100 | #300 | Tragic 13.2% |
| Immigrants | Micronesia | 0.0 /100 | #301 | Tragic 13.2% |
| Arapaho | 0.0 /100 | #302 | Tragic 13.2% |
| Scotch-Irish | 0.0 /100 | #303 | Tragic 13.3% |
| Yakama | 0.0 /100 | #304 | Tragic 13.4% |
| French Canadians | 0.0 /100 | #305 | Tragic 13.4% |
| Cape Verdeans | 0.0 /100 | #306 | Tragic 13.5% |
| Shoshone | 0.0 /100 | #307 | Tragic 13.5% |
| French American Indians | 0.0 /100 | #308 | Tragic 13.5% |
| Tlingit-Haida | 0.0 /100 | #309 | Tragic 13.5% |
| Blackfeet | 0.0 /100 | #310 | Tragic 13.6% |
| Delaware | 0.0 /100 | #311 | Tragic 13.6% |
| Spanish Americans | 0.0 /100 | #312 | Tragic 13.6% |
| Cree | 0.0 /100 | #313 | Tragic 13.7% |
Demographics Similar to Immigrants from Portugal by Disability
In terms of disability, the demographic groups most similar to Immigrants from Portugal are Spanish (12.8%, a difference of 0.14%), Scottish (12.9%, a difference of 0.14%), Irish (12.9%, a difference of 0.16%), Fijian (12.8%, a difference of 0.19%), and German (12.8%, a difference of 0.29%).
| Demographics | Rating | Rank | Disability |
| Nepalese | 0.0 /100 | #274 | Tragic 12.8% |
| Sioux | 0.0 /100 | #275 | Tragic 12.8% |
| Hmong | 0.0 /100 | #276 | Tragic 12.8% |
| Dutch | 0.0 /100 | #277 | Tragic 12.8% |
| Germans | 0.0 /100 | #278 | Tragic 12.8% |
| Fijians | 0.0 /100 | #279 | Tragic 12.8% |
| Spanish | 0.0 /100 | #280 | Tragic 12.8% |
| Immigrants | Portugal | 0.0 /100 | #281 | Tragic 12.9% |
| Scottish | 0.0 /100 | #282 | Tragic 12.9% |
| Irish | 0.0 /100 | #283 | Tragic 12.9% |
| Welsh | 0.0 /100 | #284 | Tragic 12.9% |
| Crow | 0.0 /100 | #285 | Tragic 12.9% |
| English | 0.0 /100 | #286 | Tragic 13.0% |
| Africans | 0.0 /100 | #287 | Tragic 13.0% |
| Whites/Caucasians | 0.0 /100 | #288 | Tragic 13.0% |