Immigrants from Micronesia vs Immigrants from Portugal Currently Married
COMPARE
Immigrants from Micronesia
Immigrants from Portugal
Currently Married
Currently Married Comparison
Immigrants from Micronesia
Immigrants from Portugal
45.6%
CURRENTLY MARRIED
8.8/ 100
METRIC RATING
209th/ 347
METRIC RANK
45.2%
CURRENTLY MARRIED
3.5/ 100
METRIC RATING
219th/ 347
METRIC RANK
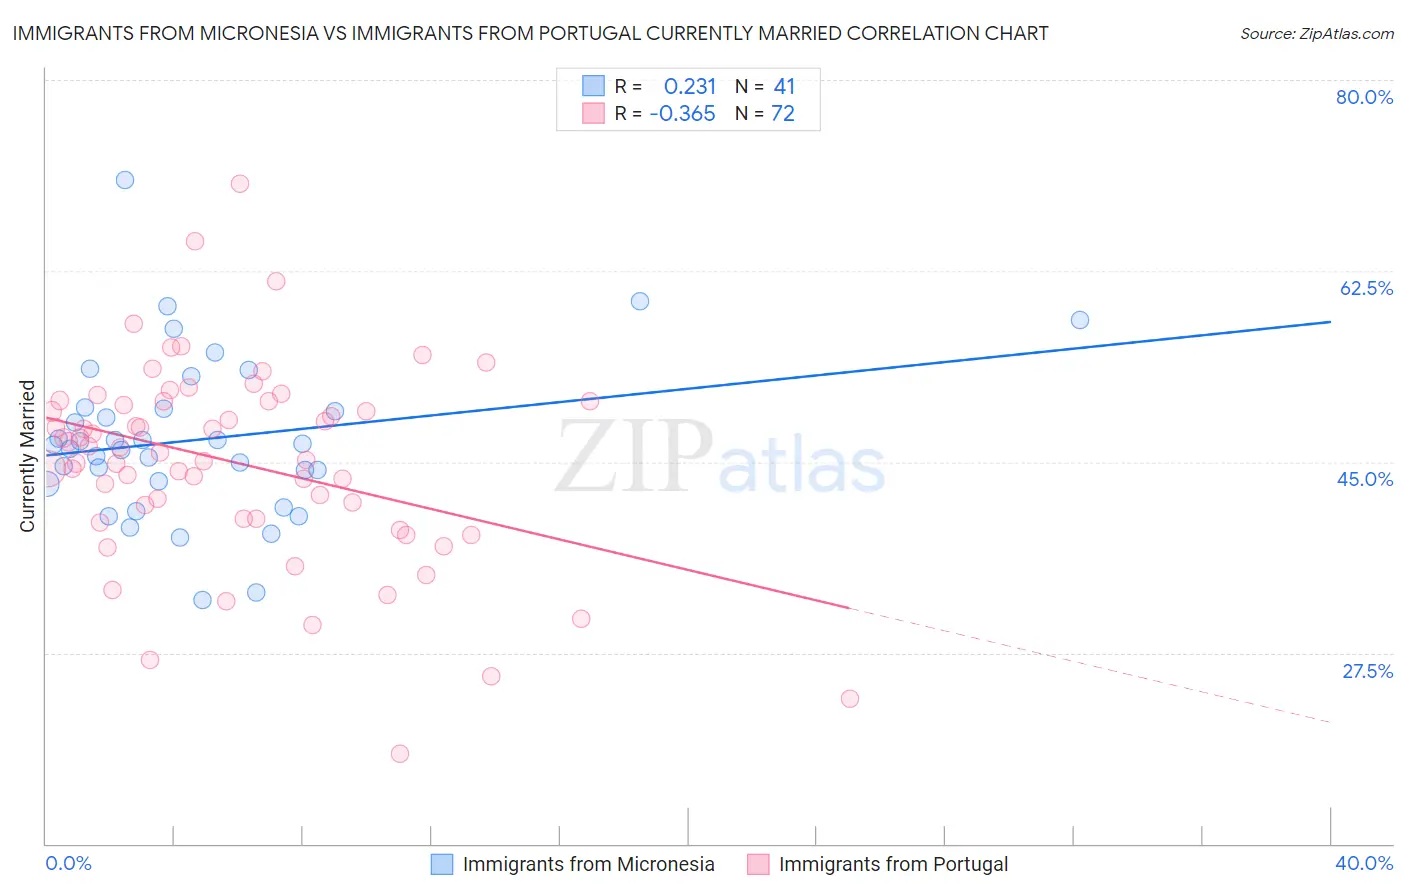
Immigrants from Micronesia vs Immigrants from Portugal Currently Married Correlation Chart
The statistical analysis conducted on geographies consisting of 61,606,735 people shows a weak positive correlation between the proportion of Immigrants from Micronesia and percentage of population currently married in the United States with a correlation coefficient (R) of 0.231 and weighted average of 45.6%. Similarly, the statistical analysis conducted on geographies consisting of 174,784,868 people shows a mild negative correlation between the proportion of Immigrants from Portugal and percentage of population currently married in the United States with a correlation coefficient (R) of -0.365 and weighted average of 45.2%, a difference of 0.92%.
Currently Married Correlation Summary
| Measurement | Immigrants from Micronesia | Immigrants from Portugal |
| Minimum | 32.3% | 18.3% |
| Maximum | 70.8% | 70.5% |
| Range | 38.5% | 52.2% |
| Mean | 47.1% | 44.9% |
| Median | 46.5% | 46.1% |
| Interquartile 25% (IQ1) | 43.1% | 39.8% |
| Interquartile 75% (IQ3) | 49.9% | 50.5% |
| Interquartile Range (IQR) | 6.8% | 10.8% |
| Standard Deviation (Sample) | 7.4% | 9.1% |
| Standard Deviation (Population) | 7.3% | 9.1% |
Demographics Similar to Immigrants from Micronesia and Immigrants from Portugal by Currently Married
In terms of currently married, the demographic groups most similar to Immigrants from Micronesia are Uruguayan (45.6%, a difference of 0.11%), Houma (45.5%, a difference of 0.20%), Marshallese (45.5%, a difference of 0.20%), Alsatian (45.7%, a difference of 0.21%), and Immigrants from South America (45.7%, a difference of 0.22%). Similarly, the demographic groups most similar to Immigrants from Portugal are Panamanian (45.3%, a difference of 0.12%), Kenyan (45.2%, a difference of 0.13%), Mexican (45.2%, a difference of 0.14%), Immigrants from the Azores (45.1%, a difference of 0.34%), and Immigrants from Thailand (45.4%, a difference of 0.36%).
| Demographics | Rating | Rank | Currently Married |
| Immigrants | Spain | 11.6 /100 | #204 | Poor 45.8% |
| South American Indians | 11.5 /100 | #205 | Poor 45.8% |
| Immigrants | Immigrants | 11.2 /100 | #206 | Poor 45.8% |
| Immigrants | South America | 10.8 /100 | #207 | Poor 45.7% |
| Alsatians | 10.8 /100 | #208 | Poor 45.7% |
| Immigrants | Micronesia | 8.8 /100 | #209 | Tragic 45.6% |
| Uruguayans | 7.9 /100 | #210 | Tragic 45.6% |
| Houma | 7.2 /100 | #211 | Tragic 45.5% |
| Marshallese | 7.2 /100 | #212 | Tragic 45.5% |
| Alaska Natives | 7.0 /100 | #213 | Tragic 45.5% |
| Dutch West Indians | 6.7 /100 | #214 | Tragic 45.5% |
| German Russians | 6.7 /100 | #215 | Tragic 45.5% |
| Immigrants | Morocco | 5.5 /100 | #216 | Tragic 45.4% |
| Immigrants | Thailand | 5.1 /100 | #217 | Tragic 45.4% |
| Panamanians | 4.0 /100 | #218 | Tragic 45.3% |
| Immigrants | Portugal | 3.5 /100 | #219 | Tragic 45.2% |
| Kenyans | 3.1 /100 | #220 | Tragic 45.2% |
| Mexicans | 3.0 /100 | #221 | Tragic 45.2% |
| Immigrants | Azores | 2.5 /100 | #222 | Tragic 45.1% |
| Immigrants | Laos | 2.3 /100 | #223 | Tragic 45.0% |
| Immigrants | Uganda | 2.2 /100 | #224 | Tragic 45.0% |