Immigrants from Denmark vs Norwegian Disability Age 5 to 17

COMPARE

Immigrants from Denmark
Race
Ancestry
AfghanAfricanAlaska NativeAlaskan AthabascanAlbanianAleutAlsatianAmericanApacheArabArapahoArgentineanArmenianAssyrian/Chaldean/SyriacAustralianAustrianBahamianBangladeshiBarbadianBasqueBelgianBelizeanBermudanBhutaneseBlackfeetBolivianBrazilianBritishBritish West IndianBulgarianBurmeseCajunCambodianCanadianCape VerdeanCarpatho RusynCelticCentral AmericanCentral American IndianCherokeeCheyenneChickasawChileanChineseChippewaChoctawColombianColvilleComancheCosta RicanCreeCreekCroatianCrowCubanCypriotCzechCzechoslovakianDanishDelawareDominicanDutchDutch West IndianEastern EuropeanEcuadorianEgyptianEnglishEstonianEthiopianEuropeanFijianFilipinoFinnishFrenchFrench American IndianFrench CanadianGermanGerman RussianGhanaianGreekGuamanian/ChamorroGuatemalanGuyaneseHaitianHmongHonduranHopiHoumaHungarianIcelanderIndian (Asian)IndonesianInupiatIranianIraqiIrishIroquoisIsraeliItalianJamaicanJapaneseJordanianKenyanKiowaKoreanLaotianLatvianLebaneseLiberianLithuanianLumbeeLuxembourgerMacedonianMalaysianMalteseMarshalleseMenomineeMexicanMexican American IndianMongolianMoroccanNative HawaiianNavajoNepaleseNew ZealanderNicaraguanNigerianNorthern EuropeanOkinawanOsageOttawaPaiutePakistaniPalestinianPanamanianParaguayanPennsylvania GermanPeruvianPimaPolishPortuguesePotawatomiPuebloPuerto RicanPuget Sound SalishRomanianRussianSalvadoranSamoanScandinavianScotch-IrishScottishSeminoleSenegaleseSerbianShoshoneSierra LeoneanSiouxSlavicSlovakSloveneSomaliSouth AfricanSouth AmericanSouth American IndianSoviet UnionSpaniardSpanishSpanish AmericanSpanish American IndianSri LankanSubsaharan AfricanSudaneseSwedishSwissSyrianTaiwaneseThaiTlingit-HaidaTohono O'OdhamTonganTrinidadian and TobagonianTsimshianTurkishU.S. Virgin IslanderUgandanUkrainianUruguayanUteVenezuelanVietnameseWelshWest IndianYakamaYaquiYugoslavianYumanYup'ikZimbabwean
Immigration
NonimmigrantsImmigrantsAfghanistanAfricaAlbaniaArgentinaArmeniaAsiaAustraliaAustriaBahamasBangladeshBarbadosBelarusBelgiumBelizeBoliviaBosnia and HerzegovinaBrazilBulgariaBurma/MyanmarCabo VerdeCambodiaCameroonCanadaCaribbeanCentral AmericaChileChinaColombiaCongoCosta RicaCroatiaCubaCzechoslovakiaDenmarkDominicaDominican RepublicEastern AfricaEastern AsiaEastern EuropeEcuadorEgyptEl SalvadorEnglandEritreaEthiopiaEuropeFijiFranceGermanyGhanaGreeceGrenadaGuatemalaGuyanaHaitiHondurasHong KongHungaryIndiaIndonesiaIranIraqIrelandIsraelItalyJamaicaJapanJordanKazakhstanKenyaKoreaKuwaitLaosLatin AmericaLatviaLebanonLiberiaLithuaniaMalaysiaMexicoMicronesiaMiddle AfricaMoldovaMoroccoNepalNetherlandsNicaraguaNigeriaNorth AmericaNorth MacedoniaNorthern AfricaNorthern EuropeNorwayOceaniaPakistanPanamaPeruPhilippinesPolandPortugalRomaniaRussiaSaudi ArabiaScotlandSenegalSerbiaSierra LeoneSingaporeSomaliaSouth AfricaSouth AmericaSouth Central AsiaSouth Eastern AsiaSouthern EuropeSpainSri LankaSt. Vincent and the GrenadinesSudanSwedenSwitzerlandSyriaTaiwanThailandTrinidad and TobagoTurkeyUgandaUkraineUruguayUzbekistanVenezuelaVietnamWest IndiesWestern AfricaWestern AsiaWestern EuropeYemenZaireZimbabweAzores
Norwegian
Race
Ancestry
AfghanAfricanAlaska NativeAlaskan AthabascanAlbanianAleutAlsatianAmericanApacheArabArapahoArgentineanArmenianAssyrian/Chaldean/SyriacAustralianAustrianBahamianBangladeshiBarbadianBasqueBelgianBelizeanBermudanBhutaneseBlackfeetBolivianBrazilianBritishBritish West IndianBulgarianBurmeseCajunCambodianCanadianCape VerdeanCarpatho RusynCelticCentral AmericanCentral American IndianCherokeeCheyenneChickasawChileanChineseChippewaChoctawColombianColvilleComancheCosta RicanCreeCreekCroatianCrowCubanCypriotCzechCzechoslovakianDanishDelawareDominicanDutchDutch West IndianEastern EuropeanEcuadorianEgyptianEnglishEstonianEthiopianEuropeanFijianFilipinoFinnishFrenchFrench American IndianFrench CanadianGermanGerman RussianGhanaianGreekGuamanian/ChamorroGuatemalanGuyaneseHaitianHmongHonduranHopiHoumaHungarianIcelanderIndian (Asian)IndonesianInupiatIranianIraqiIrishIroquoisIsraeliItalianJamaicanJapaneseJordanianKenyanKiowaKoreanLaotianLatvianLebaneseLiberianLithuanianLumbeeLuxembourgerMacedonianMalaysianMalteseMarshalleseMenomineeMexicanMexican American IndianMongolianMoroccanNative HawaiianNavajoNepaleseNew ZealanderNicaraguanNigerianNorthern EuropeanNorwegianOkinawanOsageOttawaPaiutePakistaniPalestinianPanamanianParaguayanPennsylvania GermanPeruvianPimaPolishPortuguesePotawatomiPuebloPuerto RicanPuget Sound SalishRomanianRussianSalvadoranSamoanScandinavianScotch-IrishScottishSeminoleSenegaleseSerbianShoshoneSierra LeoneanSiouxSlavicSlovakSloveneSomaliSouth AfricanSouth AmericanSouth American IndianSoviet UnionSpaniardSpanishSpanish AmericanSpanish American IndianSri LankanSubsaharan AfricanSudaneseSwedishSwissSyrianTaiwaneseThaiTlingit-HaidaTohono O'OdhamTonganTrinidadian and TobagonianTsimshianTurkishU.S. Virgin IslanderUgandanUkrainianUruguayanUteVenezuelanVietnameseWelshWest IndianYakamaYaquiYugoslavianYumanYup'ikZimbabwean
Immigration
NonimmigrantsImmigrantsAfghanistanAfricaAlbaniaArgentinaArmeniaAsiaAustraliaAustriaBahamasBangladeshBarbadosBelarusBelgiumBelizeBoliviaBosnia and HerzegovinaBrazilBulgariaBurma/MyanmarCabo VerdeCambodiaCameroonCanadaCaribbeanCentral AmericaChileChinaColombiaCongoCosta RicaCroatiaCubaCzechoslovakiaDominicaDominican RepublicEastern AfricaEastern AsiaEastern EuropeEcuadorEgyptEl SalvadorEnglandEritreaEthiopiaEuropeFijiFranceGermanyGhanaGreeceGrenadaGuatemalaGuyanaHaitiHondurasHong KongHungaryIndiaIndonesiaIranIraqIrelandIsraelItalyJamaicaJapanJordanKazakhstanKenyaKoreaKuwaitLaosLatin AmericaLatviaLebanonLiberiaLithuaniaMalaysiaMexicoMicronesiaMiddle AfricaMoldovaMoroccoNepalNetherlandsNicaraguaNigeriaNorth AmericaNorth MacedoniaNorthern AfricaNorthern EuropeNorwayOceaniaPakistanPanamaPeruPhilippinesPolandPortugalRomaniaRussiaSaudi ArabiaScotlandSenegalSerbiaSierra LeoneSingaporeSomaliaSouth AfricaSouth AmericaSouth Central AsiaSouth Eastern AsiaSouthern EuropeSpainSri LankaSt. Vincent and the GrenadinesSudanSwedenSwitzerlandSyriaTaiwanThailandTrinidad and TobagoTurkeyUgandaUkraineUruguayUzbekistanVenezuelaVietnamWest IndiesWestern AfricaWestern AsiaWestern EuropeYemenZaireZimbabweAzores
Disability Age 5 to 17
Income
Poverty
Unemployment
Labor Participation
Family Structure
Vehicle Availability
Education Level
Disability

Disability Age 5 to 17 Comparison

Immigrants from Denmark

Norwegians

Exceptional
Fair
5.4%
DISABILITY AGE 5 TO 17
91.4/ 100
METRIC RATING
136th/ 347
METRIC RANK
5.7%
DISABILITY AGE 5 TO 17
20.9/ 100
METRIC RATING
198th/ 347
METRIC RANK

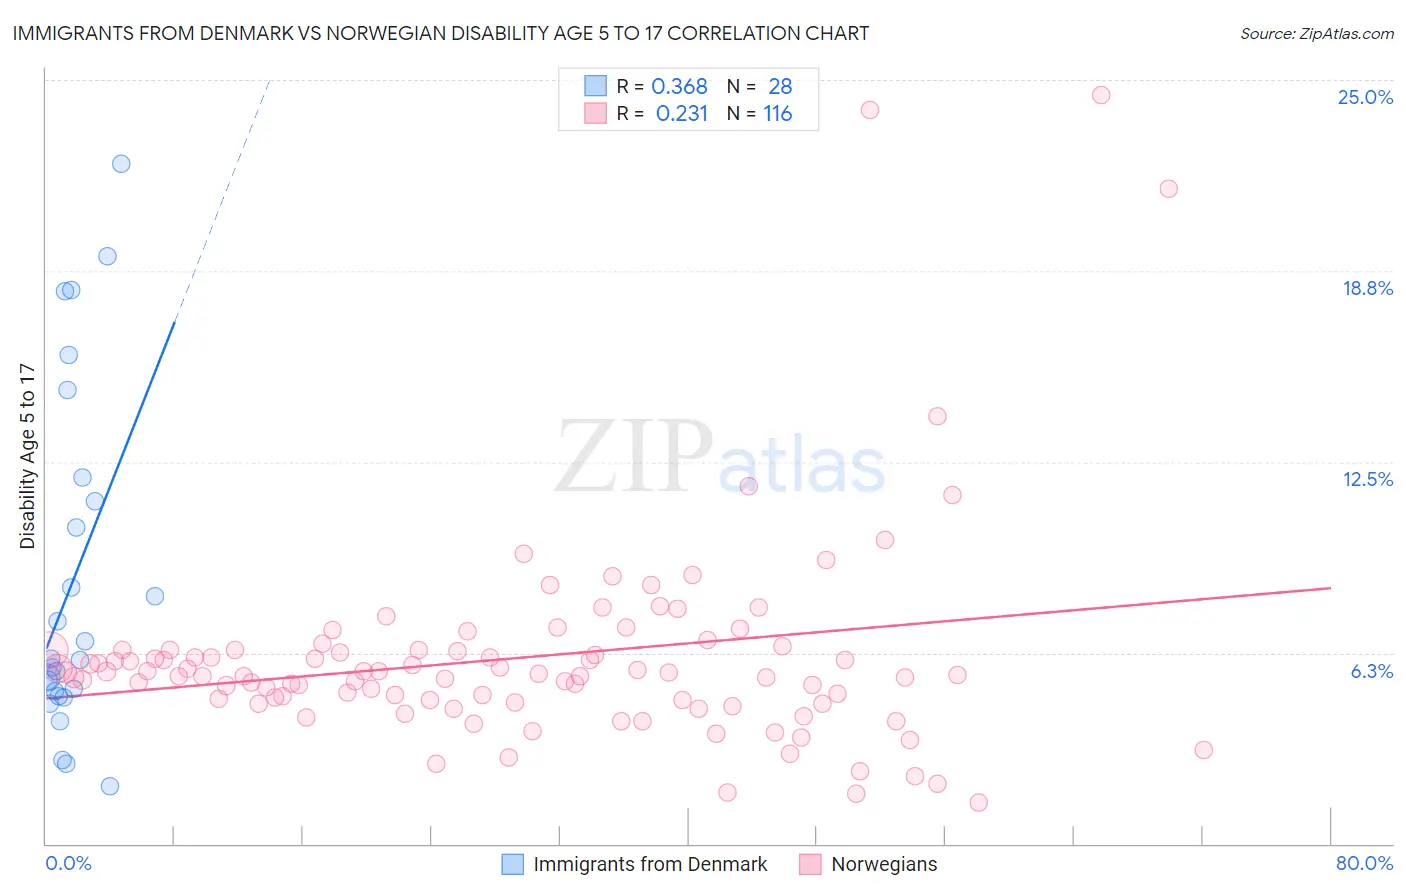
Immigrants from Denmark vs Norwegian Disability Age 5 to 17 Correlation Chart

The statistical analysis conducted on geographies consisting of 135,667,320 people shows a mild positive correlation between the proportion of Immigrants from Denmark and percentage of population with a disability between the ages 5 and 17 in the United States with a correlation coefficient (R) of 0.368 and weighted average of 5.4%. Similarly, the statistical analysis conducted on geographies consisting of 523,039,839 people shows a weak positive correlation between the proportion of Norwegians and percentage of population with a disability between the ages 5 and 17 in the United States with a correlation coefficient (R) of 0.231 and weighted average of 5.7%, a difference of 4.7%.
Immigrants from Denmark vs Norwegian Disability Age 5 to 17

Disability Age 5 to 17 Correlation Summary

MeasurementImmigrants from DenmarkNorwegian
Minimum1.9%1.4%
Maximum22.3%24.5%
Range20.4%23.2%
Mean8.7%6.1%
Median6.0%5.5%
Interquartile 25% (IQ1)4.9%4.7%
Interquartile 75% (IQ3)11.6%6.3%
Interquartile Range (IQR)6.7%1.6%
Standard Deviation (Sample)5.6%3.4%
Standard Deviation (Population)5.5%3.4%

Similar Demographics by Disability Age 5 to 17

Demographics Similar to Immigrants from Denmark by Disability Age 5 to 17

In terms of disability age 5 to 17, the demographic groups most similar to Immigrants from Denmark are Immigrants from Belize (5.4%, a difference of 0.050%), Navajo (5.4%, a difference of 0.080%), Immigrants from Oceania (5.4%, a difference of 0.090%), Belizean (5.4%, a difference of 0.090%), and Immigrants from Netherlands (5.4%, a difference of 0.14%).
DemographicsRating | RankDisability Age 5 to 17
Romanians
94.1
/100
|
#129
Exceptional
5.4%
Immigrants | Bulgaria
94.0
/100
|
#130
Exceptional
5.4%
Arabs
92.9
/100
|
#131
Exceptional
5.4%
Immigrants | Colombia
92.9
/100
|
#132
Exceptional
5.4%
Venezuelans
92.7
/100
|
#133
Exceptional
5.4%
Yuman
92.3
/100
|
#134
Exceptional
5.4%
Immigrants | Belize
91.7
/100
|
#135
Exceptional
5.4%
Immigrants | Denmark
91.4
/100
|
#136
Exceptional
5.4%
Navajo
90.9
/100
|
#137
Exceptional
5.4%
Immigrants | Oceania
90.8
/100
|
#138
Exceptional
5.4%
Belizeans
90.8
/100
|
#139
Exceptional
5.4%
Immigrants | Netherlands
90.5
/100
|
#140
Exceptional
5.4%
South American Indians
89.3
/100
|
#141
Excellent
5.5%
Colombians
88.0
/100
|
#142
Excellent
5.5%
Immigrants | Hungary
87.9
/100
|
#143
Excellent
5.5%

Demographics Similar to Norwegians by Disability Age 5 to 17

In terms of disability age 5 to 17, the demographic groups most similar to Norwegians are Immigrants from North America (5.7%, a difference of 0.16%), Inupiat (5.7%, a difference of 0.17%), Immigrants from Nigeria (5.7%, a difference of 0.18%), Croatian (5.7%, a difference of 0.19%), and Immigrants from Canada (5.7%, a difference of 0.35%).
DemographicsRating | RankDisability Age 5 to 17
Danes
26.5
/100
|
#191
Fair
5.7%
Immigrants | Bosnia and Herzegovina
26.3
/100
|
#192
Fair
5.7%
Immigrants | Canada
26.1
/100
|
#193
Fair
5.7%
Croatians
23.6
/100
|
#194
Fair
5.7%
Immigrants | Nigeria
23.4
/100
|
#195
Fair
5.7%
Inupiat
23.3
/100
|
#196
Fair
5.7%
Immigrants | North America
23.1
/100
|
#197
Fair
5.7%
Norwegians
20.9
/100
|
#198
Fair
5.7%
Northern Europeans
15.2
/100
|
#199
Poor
5.7%
Icelanders
14.6
/100
|
#200
Poor
5.7%
Basques
13.7
/100
|
#201
Poor
5.7%
Austrians
13.2
/100
|
#202
Poor
5.7%
Spanish American Indians
12.8
/100
|
#203
Poor
5.7%
Paiute
11.2
/100
|
#204
Poor
5.7%
Trinidadians and Tobagonians
10.8
/100
|
#205
Poor
5.7%