Immigrants from South America vs Native/Alaskan Ambulatory Disability
COMPARE
Immigrants from South America
Native/Alaskan
Ambulatory Disability
Ambulatory Disability Comparison
Immigrants from South America
Natives/Alaskans
5.8%
AMBULATORY DISABILITY
97.9/ 100
METRIC RATING
101st/ 347
METRIC RANK
7.5%
AMBULATORY DISABILITY
0.0/ 100
METRIC RATING
327th/ 347
METRIC RANK
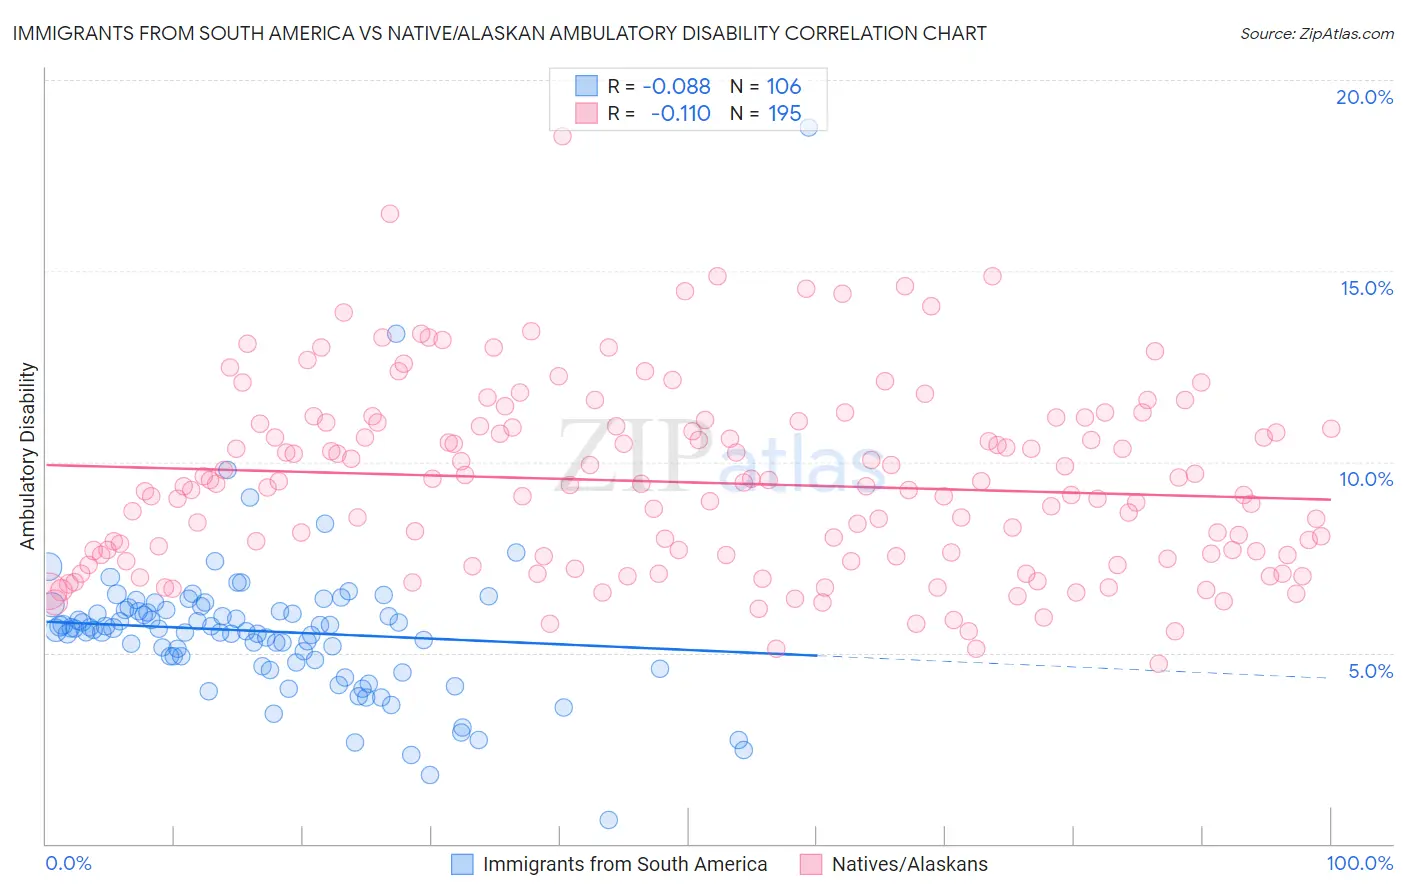
Immigrants from South America vs Native/Alaskan Ambulatory Disability Correlation Chart
The statistical analysis conducted on geographies consisting of 486,161,675 people shows a slight negative correlation between the proportion of Immigrants from South America and percentage of population with ambulatory disability in the United States with a correlation coefficient (R) of -0.088 and weighted average of 5.8%. Similarly, the statistical analysis conducted on geographies consisting of 512,715,386 people shows a poor negative correlation between the proportion of Natives/Alaskans and percentage of population with ambulatory disability in the United States with a correlation coefficient (R) of -0.110 and weighted average of 7.5%, a difference of 29.6%.
Ambulatory Disability Correlation Summary
| Measurement | Immigrants from South America | Native/Alaskan |
| Minimum | 0.63% | 4.7% |
| Maximum | 18.8% | 18.5% |
| Range | 18.1% | 13.8% |
| Mean | 5.6% | 9.5% |
| Median | 5.6% | 9.4% |
| Interquartile 25% (IQ1) | 4.7% | 7.5% |
| Interquartile 75% (IQ3) | 6.1% | 11.0% |
| Interquartile Range (IQR) | 1.4% | 3.5% |
| Standard Deviation (Sample) | 2.1% | 2.4% |
| Standard Deviation (Population) | 2.0% | 2.4% |
Similar Demographics by Ambulatory Disability
Demographics Similar to Immigrants from South America by Ambulatory Disability
In terms of ambulatory disability, the demographic groups most similar to Immigrants from South America are Immigrants from Serbia (5.8%, a difference of 0.0%), Immigrants from Kenya (5.8%, a difference of 0.080%), Immigrants from Romania (5.8%, a difference of 0.15%), Immigrants from Northern Europe (5.8%, a difference of 0.19%), and New Zealander (5.8%, a difference of 0.21%).
| Demographics | Rating | Rank | Ambulatory Disability |
| Kenyans | 98.4 /100 | #94 | Exceptional 5.8% |
| Immigrants | El Salvador | 98.4 /100 | #95 | Exceptional 5.8% |
| Salvadorans | 98.4 /100 | #96 | Exceptional 5.8% |
| Immigrants | Somalia | 98.3 /100 | #97 | Exceptional 5.8% |
| Immigrants | Lebanon | 98.3 /100 | #98 | Exceptional 5.8% |
| Immigrants | Northern Europe | 98.2 /100 | #99 | Exceptional 5.8% |
| Immigrants | Serbia | 97.9 /100 | #100 | Exceptional 5.8% |
| Immigrants | South America | 97.9 /100 | #101 | Exceptional 5.8% |
| Immigrants | Kenya | 97.8 /100 | #102 | Exceptional 5.8% |
| Immigrants | Romania | 97.7 /100 | #103 | Exceptional 5.8% |
| New Zealanders | 97.6 /100 | #104 | Exceptional 5.8% |
| Immigrants | Czechoslovakia | 97.4 /100 | #105 | Exceptional 5.8% |
| Immigrants | Morocco | 97.3 /100 | #106 | Exceptional 5.8% |
| Uruguayans | 97.2 /100 | #107 | Exceptional 5.8% |
| Colombians | 97.2 /100 | #108 | Exceptional 5.8% |
Demographics Similar to Natives/Alaskans by Ambulatory Disability
In terms of ambulatory disability, the demographic groups most similar to Natives/Alaskans are Black/African American (7.5%, a difference of 0.010%), Comanche (7.5%, a difference of 0.12%), Navajo (7.5%, a difference of 0.20%), Hopi (7.6%, a difference of 0.94%), and Pueblo (7.6%, a difference of 0.98%).
| Demographics | Rating | Rank | Ambulatory Disability |
| Potawatomi | 0.0 /100 | #320 | Tragic 7.3% |
| Apache | 0.0 /100 | #321 | Tragic 7.4% |
| Osage | 0.0 /100 | #322 | Tragic 7.4% |
| Americans | 0.0 /100 | #323 | Tragic 7.4% |
| Navajo | 0.0 /100 | #324 | Tragic 7.5% |
| Comanche | 0.0 /100 | #325 | Tragic 7.5% |
| Blacks/African Americans | 0.0 /100 | #326 | Tragic 7.5% |
| Natives/Alaskans | 0.0 /100 | #327 | Tragic 7.5% |
| Hopi | 0.0 /100 | #328 | Tragic 7.6% |
| Pueblo | 0.0 /100 | #329 | Tragic 7.6% |
| Paiute | 0.0 /100 | #330 | Tragic 7.7% |
| Cajuns | 0.0 /100 | #331 | Tragic 7.8% |
| Menominee | 0.0 /100 | #332 | Tragic 7.8% |
| Cherokee | 0.0 /100 | #333 | Tragic 7.9% |
| Yuman | 0.0 /100 | #334 | Tragic 7.9% |