Iranian vs Native/Alaskan Ambulatory Disability
COMPARE
Iranian
Native/Alaskan
Ambulatory Disability
Ambulatory Disability Comparison
Iranians
Natives/Alaskans
5.1%
AMBULATORY DISABILITY
100.0/ 100
METRIC RATING
9th/ 347
METRIC RANK
7.5%
AMBULATORY DISABILITY
0.0/ 100
METRIC RATING
327th/ 347
METRIC RANK
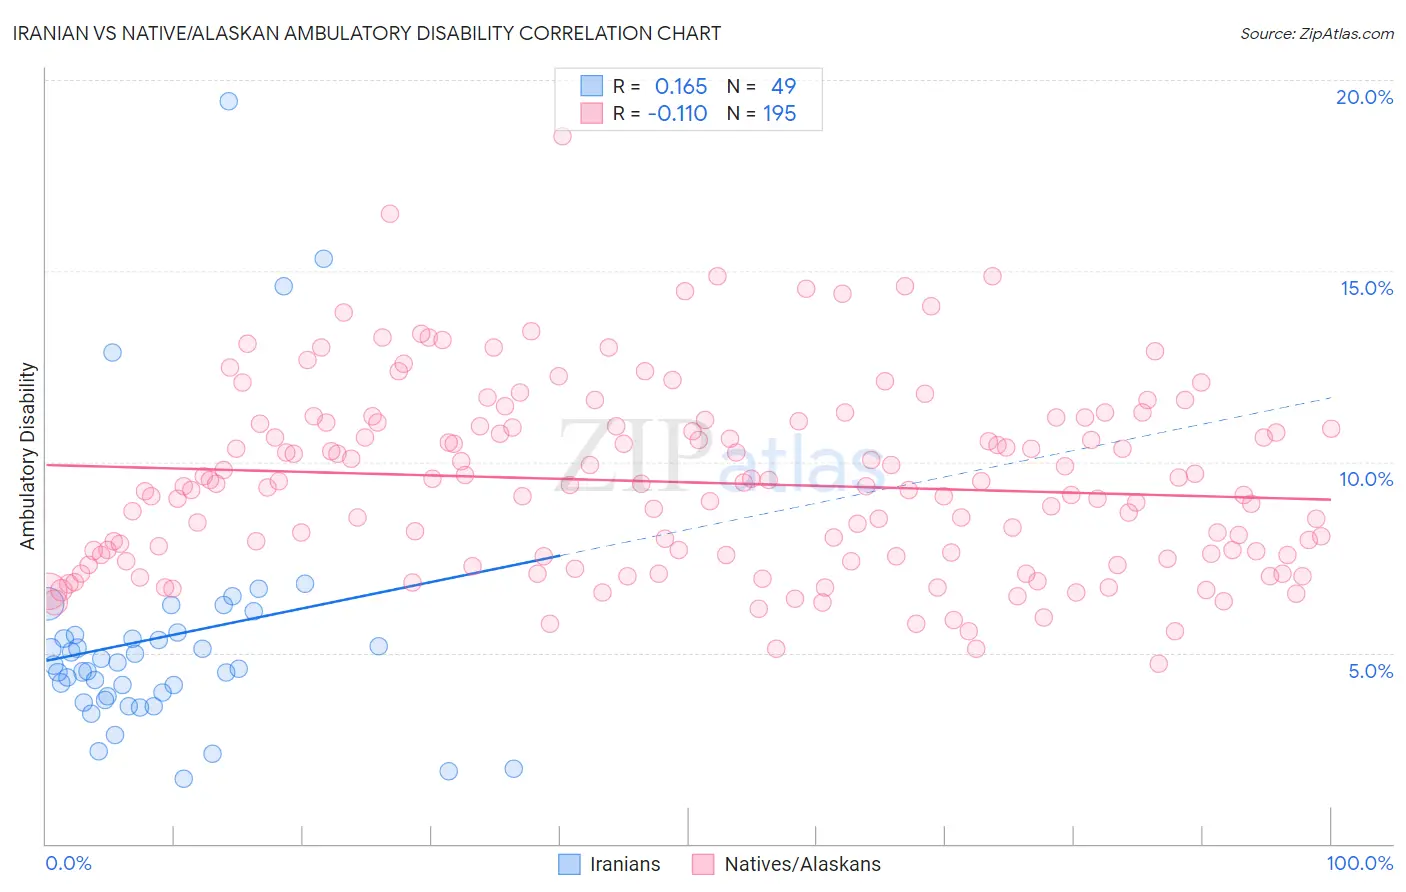
Iranian vs Native/Alaskan Ambulatory Disability Correlation Chart
The statistical analysis conducted on geographies consisting of 316,801,609 people shows a poor positive correlation between the proportion of Iranians and percentage of population with ambulatory disability in the United States with a correlation coefficient (R) of 0.165 and weighted average of 5.1%. Similarly, the statistical analysis conducted on geographies consisting of 512,715,386 people shows a poor negative correlation between the proportion of Natives/Alaskans and percentage of population with ambulatory disability in the United States with a correlation coefficient (R) of -0.110 and weighted average of 7.5%, a difference of 46.7%.
Ambulatory Disability Correlation Summary
| Measurement | Iranian | Native/Alaskan |
| Minimum | 1.7% | 4.7% |
| Maximum | 19.5% | 18.5% |
| Range | 17.7% | 13.8% |
| Mean | 5.4% | 9.5% |
| Median | 4.7% | 9.4% |
| Interquartile 25% (IQ1) | 3.8% | 7.5% |
| Interquartile 75% (IQ3) | 5.5% | 11.0% |
| Interquartile Range (IQR) | 1.7% | 3.5% |
| Standard Deviation (Sample) | 3.4% | 2.4% |
| Standard Deviation (Population) | 3.3% | 2.4% |
Similar Demographics by Ambulatory Disability
Demographics Similar to Iranians by Ambulatory Disability
In terms of ambulatory disability, the demographic groups most similar to Iranians are Immigrants from South Central Asia (5.1%, a difference of 0.36%), Yup'ik (5.2%, a difference of 0.60%), Bolivian (5.1%, a difference of 1.4%), Immigrants from Bolivia (5.0%, a difference of 1.7%), and Immigrants from Korea (5.2%, a difference of 2.2%).
| Demographics | Rating | Rank | Ambulatory Disability |
| Filipinos | 100.0 /100 | #2 | Exceptional 4.9% |
| Thais | 100.0 /100 | #3 | Exceptional 4.9% |
| Immigrants | Taiwan | 100.0 /100 | #4 | Exceptional 4.9% |
| Immigrants | Singapore | 100.0 /100 | #5 | Exceptional 5.0% |
| Immigrants | Bolivia | 100.0 /100 | #6 | Exceptional 5.0% |
| Bolivians | 100.0 /100 | #7 | Exceptional 5.1% |
| Immigrants | South Central Asia | 100.0 /100 | #8 | Exceptional 5.1% |
| Iranians | 100.0 /100 | #9 | Exceptional 5.1% |
| Yup'ik | 100.0 /100 | #10 | Exceptional 5.2% |
| Immigrants | Korea | 100.0 /100 | #11 | Exceptional 5.2% |
| Okinawans | 100.0 /100 | #12 | Exceptional 5.3% |
| Burmese | 100.0 /100 | #13 | Exceptional 5.3% |
| Immigrants | Eastern Asia | 100.0 /100 | #14 | Exceptional 5.3% |
| Immigrants | China | 100.0 /100 | #15 | Exceptional 5.3% |
| Immigrants | Hong Kong | 100.0 /100 | #16 | Exceptional 5.3% |
Demographics Similar to Natives/Alaskans by Ambulatory Disability
In terms of ambulatory disability, the demographic groups most similar to Natives/Alaskans are Black/African American (7.5%, a difference of 0.010%), Comanche (7.5%, a difference of 0.12%), Navajo (7.5%, a difference of 0.20%), Hopi (7.6%, a difference of 0.94%), and Pueblo (7.6%, a difference of 0.98%).
| Demographics | Rating | Rank | Ambulatory Disability |
| Potawatomi | 0.0 /100 | #320 | Tragic 7.3% |
| Apache | 0.0 /100 | #321 | Tragic 7.4% |
| Osage | 0.0 /100 | #322 | Tragic 7.4% |
| Americans | 0.0 /100 | #323 | Tragic 7.4% |
| Navajo | 0.0 /100 | #324 | Tragic 7.5% |
| Comanche | 0.0 /100 | #325 | Tragic 7.5% |
| Blacks/African Americans | 0.0 /100 | #326 | Tragic 7.5% |
| Natives/Alaskans | 0.0 /100 | #327 | Tragic 7.5% |
| Hopi | 0.0 /100 | #328 | Tragic 7.6% |
| Pueblo | 0.0 /100 | #329 | Tragic 7.6% |
| Paiute | 0.0 /100 | #330 | Tragic 7.7% |
| Cajuns | 0.0 /100 | #331 | Tragic 7.8% |
| Menominee | 0.0 /100 | #332 | Tragic 7.8% |
| Cherokee | 0.0 /100 | #333 | Tragic 7.9% |
| Yuman | 0.0 /100 | #334 | Tragic 7.9% |