Cypriot vs Mexican Hearing Disability
COMPARE
Cypriot
Mexican
Hearing Disability
Hearing Disability Comparison
Cypriots
Mexicans
2.8%
HEARING DISABILITY
92.9/ 100
METRIC RATING
110th/ 347
METRIC RANK
3.2%
HEARING DISABILITY
5.6/ 100
METRIC RATING
223rd/ 347
METRIC RANK
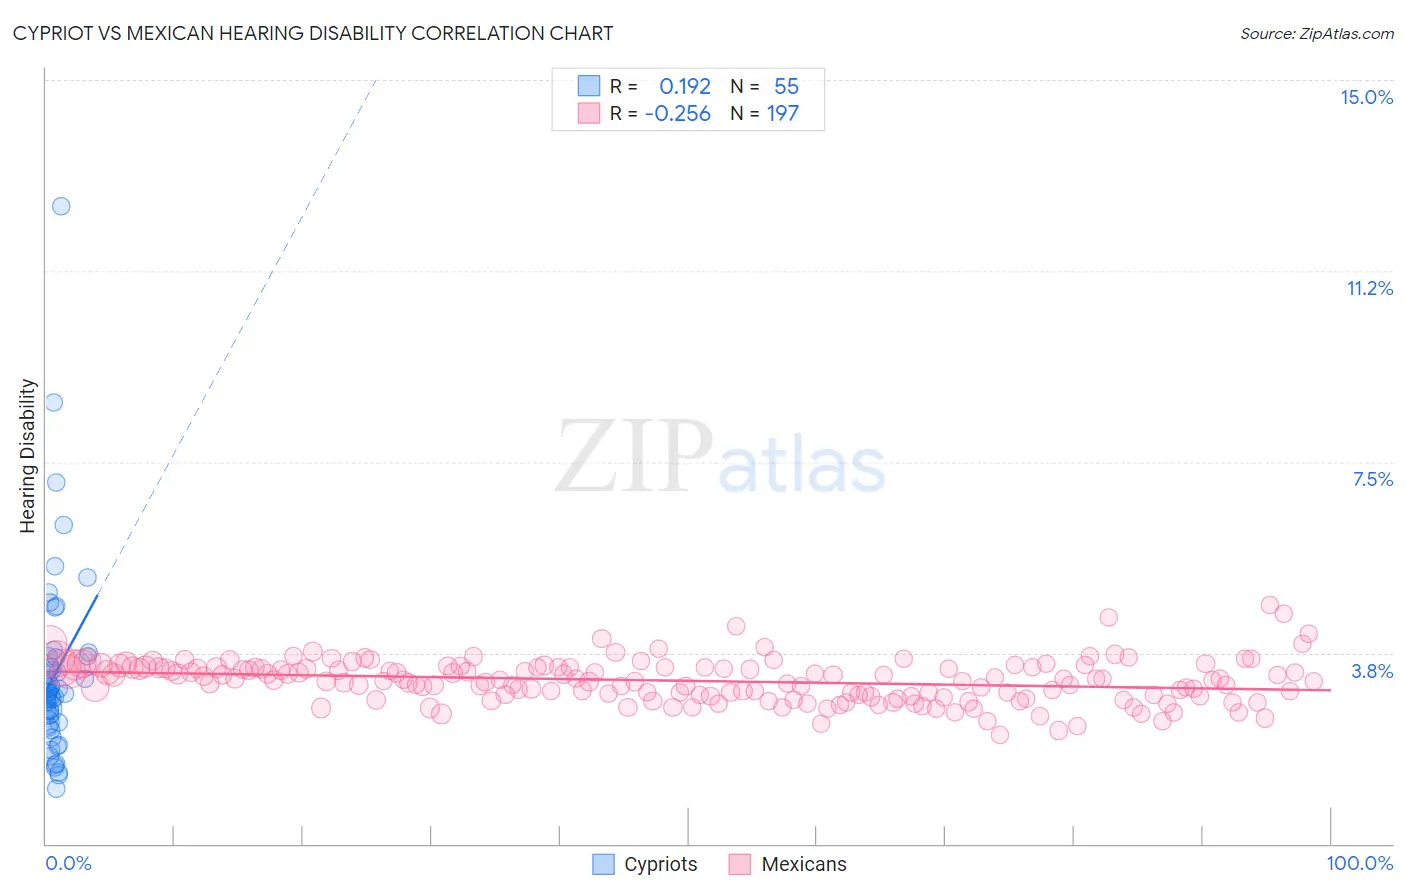
Cypriot vs Mexican Hearing Disability Correlation Chart
The statistical analysis conducted on geographies consisting of 61,868,814 people shows a poor positive correlation between the proportion of Cypriots and percentage of population with hearing disability in the United States with a correlation coefficient (R) of 0.192 and weighted average of 2.8%. Similarly, the statistical analysis conducted on geographies consisting of 564,483,125 people shows a weak negative correlation between the proportion of Mexicans and percentage of population with hearing disability in the United States with a correlation coefficient (R) of -0.256 and weighted average of 3.2%, a difference of 13.5%.
Hearing Disability Correlation Summary
| Measurement | Cypriot | Mexican |
| Minimum | 1.1% | 2.1% |
| Maximum | 12.5% | 4.7% |
| Range | 11.4% | 2.5% |
| Mean | 3.3% | 3.2% |
| Median | 3.0% | 3.2% |
| Interquartile 25% (IQ1) | 2.4% | 2.9% |
| Interquartile 75% (IQ3) | 3.7% | 3.5% |
| Interquartile Range (IQR) | 1.3% | 0.56% |
| Standard Deviation (Sample) | 1.9% | 0.41% |
| Standard Deviation (Population) | 1.9% | 0.41% |
Similar Demographics by Hearing Disability
Demographics Similar to Cypriots by Hearing Disability
In terms of hearing disability, the demographic groups most similar to Cypriots are Turkish (2.8%, a difference of 0.050%), Immigrants from Yemen (2.8%, a difference of 0.050%), Guatemalan (2.8%, a difference of 0.12%), U.S. Virgin Islander (2.8%, a difference of 0.12%), and Honduran (2.8%, a difference of 0.20%).
| Demographics | Rating | Rank | Hearing Disability |
| Immigrants | Indonesia | 94.7 /100 | #103 | Exceptional 2.8% |
| Burmese | 94.2 /100 | #104 | Exceptional 2.8% |
| Moroccans | 93.9 /100 | #105 | Exceptional 2.8% |
| Hondurans | 93.4 /100 | #106 | Exceptional 2.8% |
| Immigrants | Chile | 93.4 /100 | #107 | Exceptional 2.8% |
| Guatemalans | 93.2 /100 | #108 | Exceptional 2.8% |
| Turks | 93.0 /100 | #109 | Exceptional 2.8% |
| Cypriots | 92.9 /100 | #110 | Exceptional 2.8% |
| Immigrants | Yemen | 92.7 /100 | #111 | Exceptional 2.8% |
| U.S. Virgin Islanders | 92.5 /100 | #112 | Exceptional 2.8% |
| Immigrants | Belarus | 91.6 /100 | #113 | Exceptional 2.8% |
| Cambodians | 91.1 /100 | #114 | Exceptional 2.8% |
| Immigrants | Latin America | 90.5 /100 | #115 | Exceptional 2.8% |
| Immigrants | Immigrants | 90.3 /100 | #116 | Exceptional 2.8% |
| Immigrants | Liberia | 90.0 /100 | #117 | Excellent 2.8% |
Demographics Similar to Mexicans by Hearing Disability
In terms of hearing disability, the demographic groups most similar to Mexicans are Icelander (3.2%, a difference of 0.17%), Latvian (3.2%, a difference of 0.21%), Lebanese (3.2%, a difference of 0.25%), Immigrants from Oceania (3.2%, a difference of 0.36%), and Immigrants from Laos (3.2%, a difference of 0.40%).
| Demographics | Rating | Rank | Hearing Disability |
| Immigrants | Norway | 7.3 /100 | #216 | Tragic 3.2% |
| Russians | 7.1 /100 | #217 | Tragic 3.2% |
| Immigrants | Northern Europe | 7.0 /100 | #218 | Tragic 3.2% |
| New Zealanders | 6.8 /100 | #219 | Tragic 3.2% |
| Malaysians | 6.6 /100 | #220 | Tragic 3.2% |
| Immigrants | Laos | 6.6 /100 | #221 | Tragic 3.2% |
| Immigrants | Oceania | 6.5 /100 | #222 | Tragic 3.2% |
| Mexicans | 5.6 /100 | #223 | Tragic 3.2% |
| Icelanders | 5.2 /100 | #224 | Tragic 3.2% |
| Latvians | 5.1 /100 | #225 | Tragic 3.2% |
| Lebanese | 5.0 /100 | #226 | Tragic 3.2% |
| Bhutanese | 4.6 /100 | #227 | Tragic 3.2% |
| Immigrants | Portugal | 4.3 /100 | #228 | Tragic 3.2% |
| Maltese | 4.1 /100 | #229 | Tragic 3.2% |
| Greeks | 3.2 /100 | #230 | Tragic 3.2% |