Immigrants from Latin America vs Mexican Family Households
COMPARE
Immigrants from Latin America
Mexican
Family Households
Family Households Comparison
Immigrants from Latin America
Mexicans
67.2%
FAMILY HOUSEHOLDS
100.0/ 100
METRIC RATING
31st/ 347
METRIC RANK
69.0%
FAMILY HOUSEHOLDS
100.0/ 100
METRIC RATING
7th/ 347
METRIC RANK
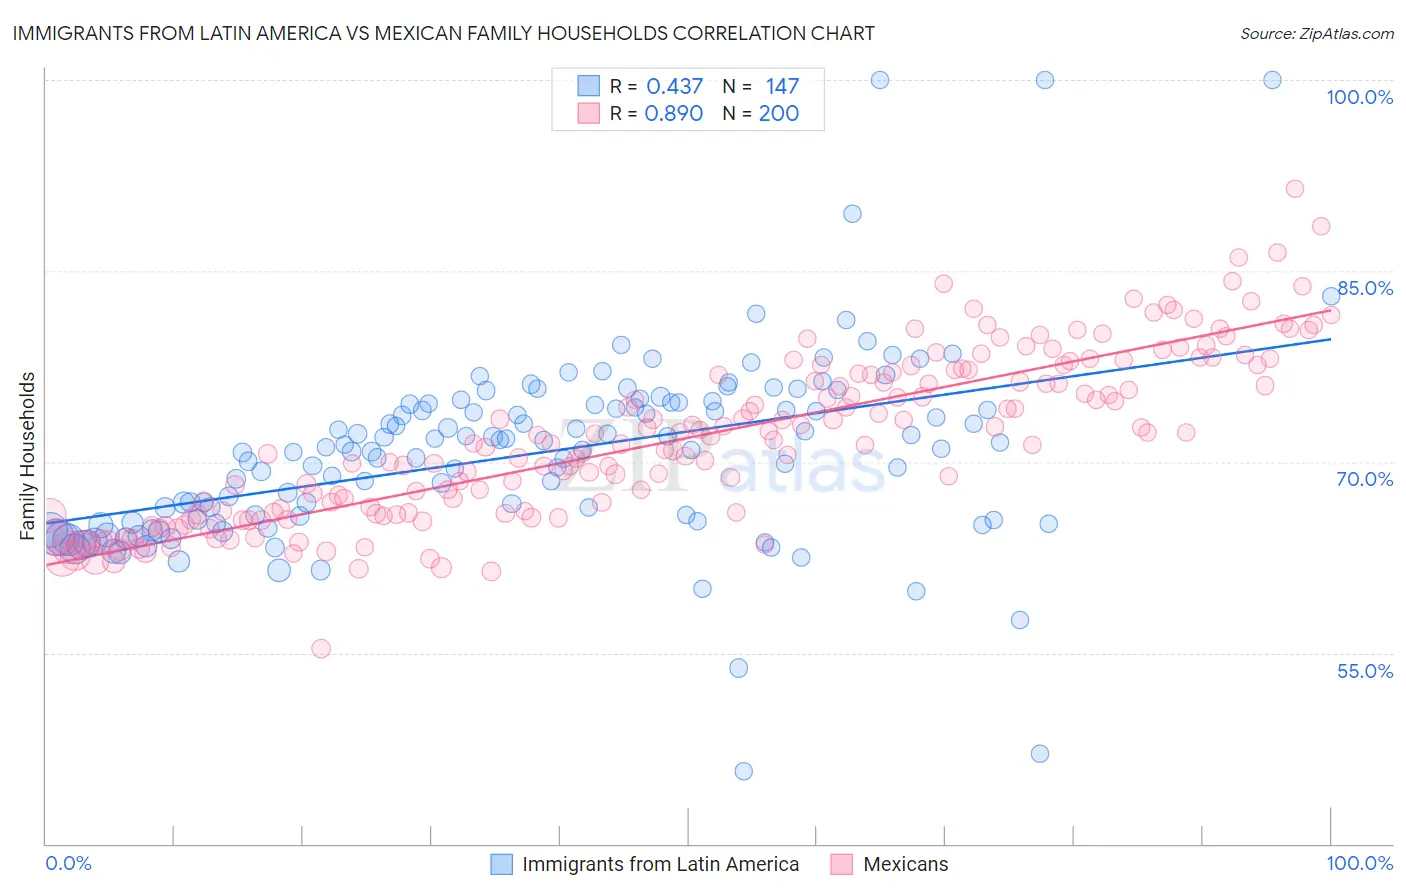
Immigrants from Latin America vs Mexican Family Households Correlation Chart
The statistical analysis conducted on geographies consisting of 558,036,504 people shows a moderate positive correlation between the proportion of Immigrants from Latin America and percentage of family households in the United States with a correlation coefficient (R) of 0.437 and weighted average of 67.2%. Similarly, the statistical analysis conducted on geographies consisting of 564,667,700 people shows a very strong positive correlation between the proportion of Mexicans and percentage of family households in the United States with a correlation coefficient (R) of 0.890 and weighted average of 69.0%, a difference of 2.6%.
Family Households Correlation Summary
| Measurement | Immigrants from Latin America | Mexican |
| Minimum | 45.7% | 55.3% |
| Maximum | 100.0% | 91.5% |
| Range | 54.3% | 36.2% |
| Mean | 70.6% | 71.9% |
| Median | 70.9% | 71.6% |
| Interquartile 25% (IQ1) | 65.3% | 66.0% |
| Interquartile 75% (IQ3) | 74.5% | 77.1% |
| Interquartile Range (IQR) | 9.3% | 11.1% |
| Standard Deviation (Sample) | 7.5% | 6.5% |
| Standard Deviation (Population) | 7.5% | 6.5% |
Similar Demographics by Family Households
Demographics Similar to Immigrants from Latin America by Family Households
In terms of family households, the demographic groups most similar to Immigrants from Latin America are Immigrants from Peru (67.2%, a difference of 0.010%), Nepalese (67.2%, a difference of 0.060%), Salvadoran (67.2%, a difference of 0.10%), Thai (67.2%, a difference of 0.10%), and Tohono O'odham (67.1%, a difference of 0.15%).
| Demographics | Rating | Rank | Family Households |
| Immigrants | South Eastern Asia | 100.0 /100 | #24 | Exceptional 67.5% |
| Immigrants | Nicaragua | 100.0 /100 | #25 | Exceptional 67.5% |
| Immigrants | India | 100.0 /100 | #26 | Exceptional 67.4% |
| Hispanics or Latinos | 100.0 /100 | #27 | Exceptional 67.4% |
| Hawaiians | 100.0 /100 | #28 | Exceptional 67.4% |
| Nicaraguans | 100.0 /100 | #29 | Exceptional 67.4% |
| Immigrants | Peru | 100.0 /100 | #30 | Exceptional 67.2% |
| Immigrants | Latin America | 100.0 /100 | #31 | Exceptional 67.2% |
| Nepalese | 100.0 /100 | #32 | Exceptional 67.2% |
| Salvadorans | 100.0 /100 | #33 | Exceptional 67.2% |
| Thais | 100.0 /100 | #34 | Exceptional 67.2% |
| Tohono O'odham | 100.0 /100 | #35 | Exceptional 67.1% |
| Peruvians | 100.0 /100 | #36 | Exceptional 67.1% |
| Tsimshian | 100.0 /100 | #37 | Exceptional 67.1% |
| Mexican American Indians | 100.0 /100 | #38 | Exceptional 67.0% |
Demographics Similar to Mexicans by Family Households
In terms of family households, the demographic groups most similar to Mexicans are Immigrants from Mexico (69.1%, a difference of 0.21%), Immigrants from Fiji (68.8%, a difference of 0.32%), Yuman (69.3%, a difference of 0.45%), Yakama (69.3%, a difference of 0.47%), and Native Hawaiian (68.4%, a difference of 0.88%).
| Demographics | Rating | Rank | Family Households |
| Yup'ik | 100 /100 | #1 | Exceptional 72.4% |
| Spanish American Indians | 100.0 /100 | #2 | Exceptional 71.2% |
| Tongans | 100.0 /100 | #3 | Exceptional 69.6% |
| Yakama | 100.0 /100 | #4 | Exceptional 69.3% |
| Yuman | 100.0 /100 | #5 | Exceptional 69.3% |
| Immigrants | Mexico | 100.0 /100 | #6 | Exceptional 69.1% |
| Mexicans | 100.0 /100 | #7 | Exceptional 69.0% |
| Immigrants | Fiji | 100.0 /100 | #8 | Exceptional 68.8% |
| Native Hawaiians | 100.0 /100 | #9 | Exceptional 68.4% |
| Immigrants | Philippines | 100.0 /100 | #10 | Exceptional 68.3% |
| Immigrants | Central America | 100.0 /100 | #11 | Exceptional 68.3% |
| Koreans | 100.0 /100 | #12 | Exceptional 68.3% |
| Pueblo | 100.0 /100 | #13 | Exceptional 68.2% |
| Immigrants | Cuba | 100.0 /100 | #14 | Exceptional 68.2% |
| Assyrians/Chaldeans/Syriacs | 100.0 /100 | #15 | Exceptional 68.2% |