Immigrants from North Macedonia vs Mexican Hearing Disability
COMPARE
Immigrants from North Macedonia
Mexican
Hearing Disability
Hearing Disability Comparison
Immigrants from North Macedonia
Mexicans
3.1%
HEARING DISABILITY
19.1/ 100
METRIC RATING
200th/ 347
METRIC RANK
3.2%
HEARING DISABILITY
5.6/ 100
METRIC RATING
223rd/ 347
METRIC RANK
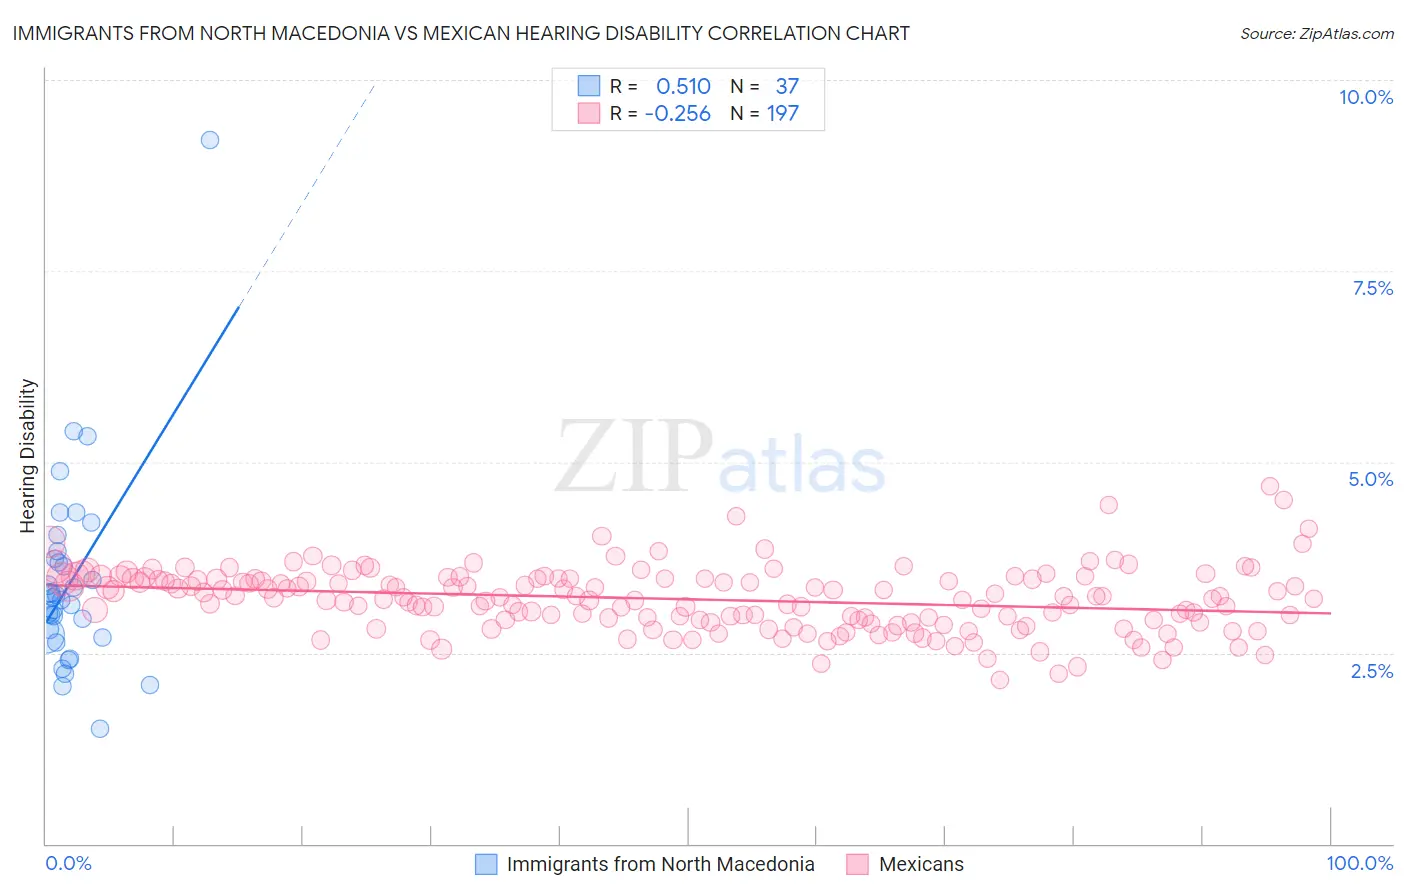
Immigrants from North Macedonia vs Mexican Hearing Disability Correlation Chart
The statistical analysis conducted on geographies consisting of 74,314,151 people shows a substantial positive correlation between the proportion of Immigrants from North Macedonia and percentage of population with hearing disability in the United States with a correlation coefficient (R) of 0.510 and weighted average of 3.1%. Similarly, the statistical analysis conducted on geographies consisting of 564,483,125 people shows a weak negative correlation between the proportion of Mexicans and percentage of population with hearing disability in the United States with a correlation coefficient (R) of -0.256 and weighted average of 3.2%, a difference of 3.1%.
Hearing Disability Correlation Summary
| Measurement | Immigrants from North Macedonia | Mexican |
| Minimum | 1.5% | 2.1% |
| Maximum | 9.2% | 4.7% |
| Range | 7.7% | 2.5% |
| Mean | 3.4% | 3.2% |
| Median | 3.2% | 3.2% |
| Interquartile 25% (IQ1) | 2.7% | 2.9% |
| Interquartile 75% (IQ3) | 3.8% | 3.5% |
| Interquartile Range (IQR) | 1.1% | 0.56% |
| Standard Deviation (Sample) | 1.3% | 0.41% |
| Standard Deviation (Population) | 1.3% | 0.41% |
Similar Demographics by Hearing Disability
Demographics Similar to Immigrants from North Macedonia by Hearing Disability
In terms of hearing disability, the demographic groups most similar to Immigrants from North Macedonia are Syrian (3.1%, a difference of 0.010%), Iraqi (3.1%, a difference of 0.020%), Immigrants from Croatia (3.1%, a difference of 0.19%), Immigrants from Bosnia and Herzegovina (3.1%, a difference of 0.21%), and Immigrants from Thailand (3.1%, a difference of 0.42%).
| Demographics | Rating | Rank | Hearing Disability |
| Macedonians | 27.0 /100 | #193 | Fair 3.1% |
| South Africans | 24.5 /100 | #194 | Fair 3.1% |
| Spanish American Indians | 24.1 /100 | #195 | Fair 3.1% |
| Immigrants | Europe | 22.9 /100 | #196 | Fair 3.1% |
| Immigrants | Bosnia and Herzegovina | 20.6 /100 | #197 | Fair 3.1% |
| Immigrants | Croatia | 20.5 /100 | #198 | Fair 3.1% |
| Syrians | 19.2 /100 | #199 | Poor 3.1% |
| Immigrants | North Macedonia | 19.1 /100 | #200 | Poor 3.1% |
| Iraqis | 19.0 /100 | #201 | Poor 3.1% |
| Immigrants | Thailand | 16.4 /100 | #202 | Poor 3.1% |
| Immigrants | Denmark | 16.2 /100 | #203 | Poor 3.1% |
| Immigrants | Czechoslovakia | 15.9 /100 | #204 | Poor 3.1% |
| Alsatians | 15.9 /100 | #205 | Poor 3.1% |
| Eastern Europeans | 15.5 /100 | #206 | Poor 3.1% |
| Hispanics or Latinos | 15.1 /100 | #207 | Poor 3.1% |
Demographics Similar to Mexicans by Hearing Disability
In terms of hearing disability, the demographic groups most similar to Mexicans are Icelander (3.2%, a difference of 0.17%), Latvian (3.2%, a difference of 0.21%), Lebanese (3.2%, a difference of 0.25%), Immigrants from Oceania (3.2%, a difference of 0.36%), and Immigrants from Laos (3.2%, a difference of 0.40%).
| Demographics | Rating | Rank | Hearing Disability |
| Immigrants | Norway | 7.3 /100 | #216 | Tragic 3.2% |
| Russians | 7.1 /100 | #217 | Tragic 3.2% |
| Immigrants | Northern Europe | 7.0 /100 | #218 | Tragic 3.2% |
| New Zealanders | 6.8 /100 | #219 | Tragic 3.2% |
| Malaysians | 6.6 /100 | #220 | Tragic 3.2% |
| Immigrants | Laos | 6.6 /100 | #221 | Tragic 3.2% |
| Immigrants | Oceania | 6.5 /100 | #222 | Tragic 3.2% |
| Mexicans | 5.6 /100 | #223 | Tragic 3.2% |
| Icelanders | 5.2 /100 | #224 | Tragic 3.2% |
| Latvians | 5.1 /100 | #225 | Tragic 3.2% |
| Lebanese | 5.0 /100 | #226 | Tragic 3.2% |
| Bhutanese | 4.6 /100 | #227 | Tragic 3.2% |
| Immigrants | Portugal | 4.3 /100 | #228 | Tragic 3.2% |
| Maltese | 4.1 /100 | #229 | Tragic 3.2% |
| Greeks | 3.2 /100 | #230 | Tragic 3.2% |