Immigrants from Russia vs Fijian Self-Care Disability
COMPARE
Immigrants from Russia
Fijian
Self-Care Disability
Self-Care Disability Comparison
Immigrants from Russia
Fijians
2.5%
SELF-CARE DISABILITY
11.0/ 100
METRIC RATING
205th/ 347
METRIC RANK
2.7%
SELF-CARE DISABILITY
0.0/ 100
METRIC RATING
284th/ 347
METRIC RANK
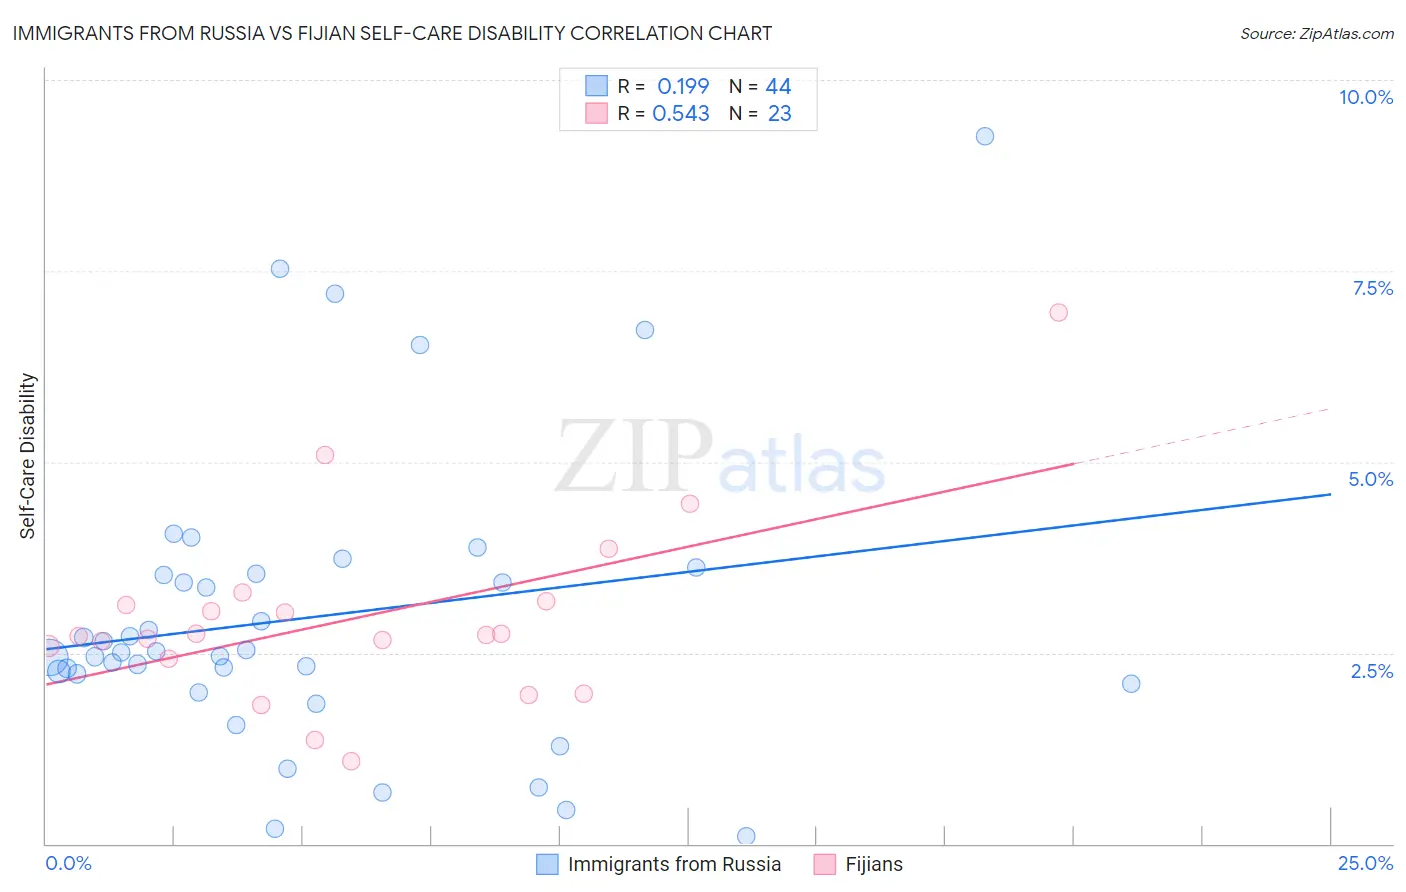
Immigrants from Russia vs Fijian Self-Care Disability Correlation Chart
The statistical analysis conducted on geographies consisting of 347,529,839 people shows a poor positive correlation between the proportion of Immigrants from Russia and percentage of population with self-care disability in the United States with a correlation coefficient (R) of 0.199 and weighted average of 2.5%. Similarly, the statistical analysis conducted on geographies consisting of 55,939,234 people shows a substantial positive correlation between the proportion of Fijians and percentage of population with self-care disability in the United States with a correlation coefficient (R) of 0.543 and weighted average of 2.7%, a difference of 6.7%.
Self-Care Disability Correlation Summary
| Measurement | Immigrants from Russia | Fijian |
| Minimum | 0.094% | 1.1% |
| Maximum | 9.3% | 7.0% |
| Range | 9.2% | 5.9% |
| Mean | 3.0% | 3.0% |
| Median | 2.5% | 2.7% |
| Interquartile 25% (IQ1) | 2.2% | 2.4% |
| Interquartile 75% (IQ3) | 3.5% | 3.2% |
| Interquartile Range (IQR) | 1.4% | 0.75% |
| Standard Deviation (Sample) | 1.9% | 1.2% |
| Standard Deviation (Population) | 1.9% | 1.2% |
Similar Demographics by Self-Care Disability
Demographics Similar to Immigrants from Russia by Self-Care Disability
In terms of self-care disability, the demographic groups most similar to Immigrants from Russia are Alaskan Athabascan (2.5%, a difference of 0.080%), Immigrants from Bahamas (2.5%, a difference of 0.10%), French (2.5%, a difference of 0.14%), Immigrants from Lebanon (2.5%, a difference of 0.15%), and Slovak (2.5%, a difference of 0.18%).
| Demographics | Rating | Rank | Self-Care Disability |
| Immigrants | Immigrants | 15.0 /100 | #198 | Poor 2.5% |
| Immigrants | Ghana | 14.7 /100 | #199 | Poor 2.5% |
| Immigrants | Western Africa | 13.3 /100 | #200 | Poor 2.5% |
| Immigrants | South Eastern Asia | 12.9 /100 | #201 | Poor 2.5% |
| Slovaks | 12.6 /100 | #202 | Poor 2.5% |
| Immigrants | Lebanon | 12.4 /100 | #203 | Poor 2.5% |
| Immigrants | Bahamas | 11.9 /100 | #204 | Poor 2.5% |
| Immigrants | Russia | 11.0 /100 | #205 | Poor 2.5% |
| Alaskan Athabascans | 10.4 /100 | #206 | Poor 2.5% |
| French | 9.9 /100 | #207 | Tragic 2.5% |
| Central Americans | 8.7 /100 | #208 | Tragic 2.5% |
| Malaysians | 7.7 /100 | #209 | Tragic 2.5% |
| Panamanians | 6.4 /100 | #210 | Tragic 2.5% |
| Native Hawaiians | 5.1 /100 | #211 | Tragic 2.6% |
| Samoans | 5.1 /100 | #212 | Tragic 2.6% |
Demographics Similar to Fijians by Self-Care Disability
In terms of self-care disability, the demographic groups most similar to Fijians are Jamaican (2.7%, a difference of 0.040%), Delaware (2.7%, a difference of 0.050%), Apache (2.7%, a difference of 0.12%), Immigrants from Iraq (2.7%, a difference of 0.13%), and Hispanic or Latino (2.7%, a difference of 0.29%).
| Demographics | Rating | Rank | Self-Care Disability |
| Immigrants | Ukraine | 0.1 /100 | #277 | Tragic 2.7% |
| Ottawa | 0.1 /100 | #278 | Tragic 2.7% |
| Iroquois | 0.1 /100 | #279 | Tragic 2.7% |
| Hispanics or Latinos | 0.1 /100 | #280 | Tragic 2.7% |
| Immigrants | Iraq | 0.0 /100 | #281 | Tragic 2.7% |
| Apache | 0.0 /100 | #282 | Tragic 2.7% |
| Delaware | 0.0 /100 | #283 | Tragic 2.7% |
| Fijians | 0.0 /100 | #284 | Tragic 2.7% |
| Jamaicans | 0.0 /100 | #285 | Tragic 2.7% |
| French American Indians | 0.0 /100 | #286 | Tragic 2.7% |
| Immigrants | Jamaica | 0.0 /100 | #287 | Tragic 2.7% |
| Immigrants | Barbados | 0.0 /100 | #288 | Tragic 2.7% |
| Africans | 0.0 /100 | #289 | Tragic 2.7% |
| Cubans | 0.0 /100 | #290 | Tragic 2.7% |
| Guyanese | 0.0 /100 | #291 | Tragic 2.7% |