Chinese vs Puget Sound Salish Disability
COMPARE
Chinese
Puget Sound Salish
Disability
Disability Comparison
Chinese
Puget Sound Salish
12.2%
DISABILITY
2.0/ 100
METRIC RATING
236th/ 347
METRIC RANK
13.7%
DISABILITY
0.0/ 100
METRIC RATING
315th/ 347
METRIC RANK
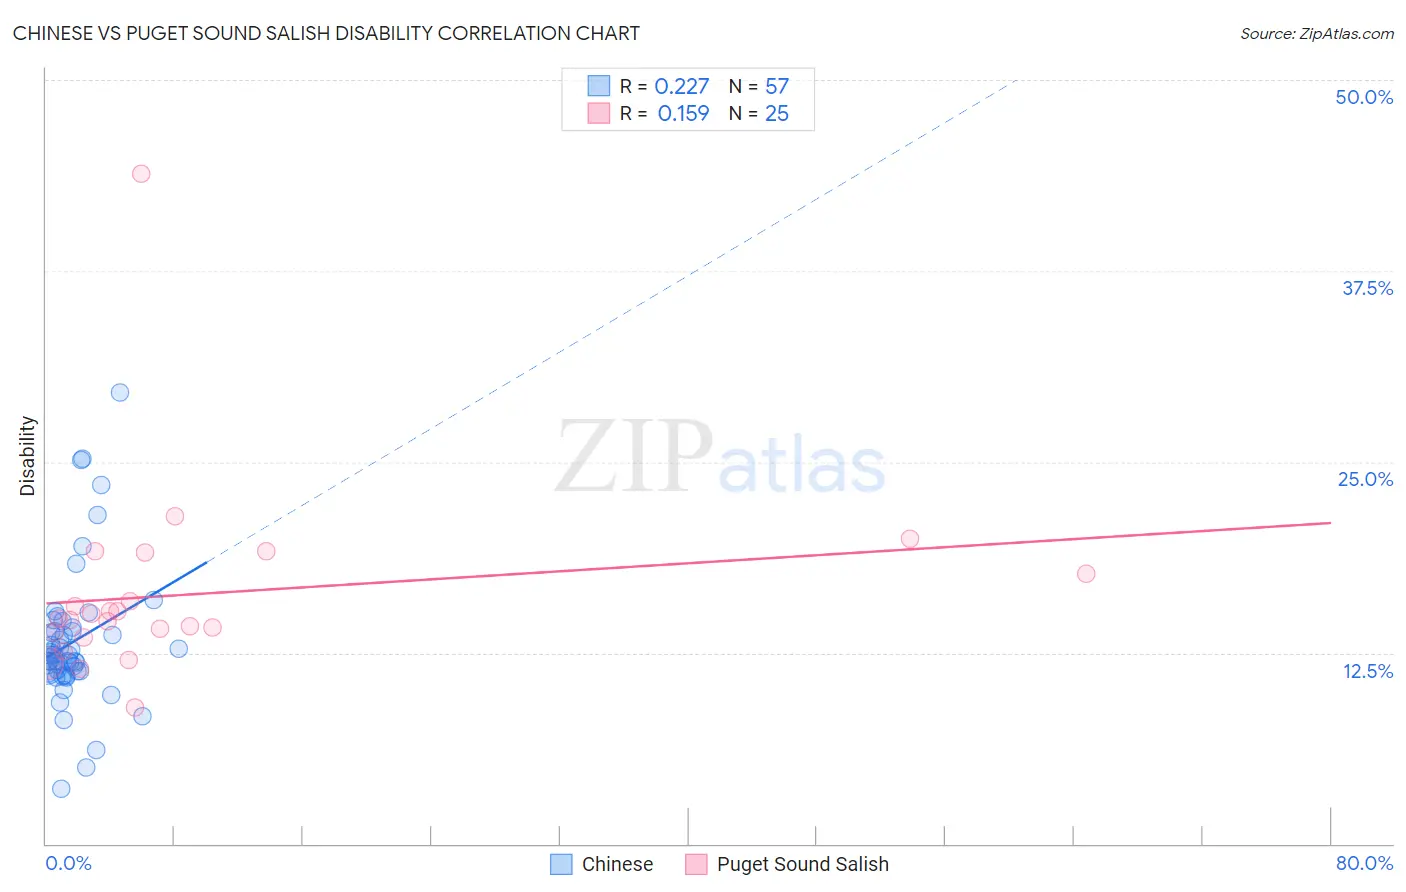
Chinese vs Puget Sound Salish Disability Correlation Chart
The statistical analysis conducted on geographies consisting of 64,802,035 people shows a weak positive correlation between the proportion of Chinese and percentage of population with a disability in the United States with a correlation coefficient (R) of 0.227 and weighted average of 12.2%. Similarly, the statistical analysis conducted on geographies consisting of 46,152,398 people shows a poor positive correlation between the proportion of Puget Sound Salish and percentage of population with a disability in the United States with a correlation coefficient (R) of 0.159 and weighted average of 13.7%, a difference of 12.3%.
Disability Correlation Summary
| Measurement | Chinese | Puget Sound Salish |
| Minimum | 3.6% | 8.9% |
| Maximum | 29.6% | 43.9% |
| Range | 26.0% | 35.0% |
| Mean | 13.2% | 16.3% |
| Median | 12.3% | 14.8% |
| Interquartile 25% (IQ1) | 11.2% | 13.7% |
| Interquartile 75% (IQ3) | 14.0% | 18.4% |
| Interquartile Range (IQR) | 2.8% | 4.7% |
| Standard Deviation (Sample) | 4.6% | 6.4% |
| Standard Deviation (Population) | 4.6% | 6.3% |
Similar Demographics by Disability
Demographics Similar to Chinese by Disability
In terms of disability, the demographic groups most similar to Chinese are Immigrants from Congo (12.2%, a difference of 0.050%), Yup'ik (12.2%, a difference of 0.090%), Norwegian (12.2%, a difference of 0.090%), Japanese (12.2%, a difference of 0.13%), and Swedish (12.2%, a difference of 0.13%).
| Demographics | Rating | Rank | Disability |
| Inupiat | 2.8 /100 | #229 | Tragic 12.2% |
| Samoans | 2.6 /100 | #230 | Tragic 12.2% |
| Malaysians | 2.5 /100 | #231 | Tragic 12.2% |
| Italians | 2.5 /100 | #232 | Tragic 12.2% |
| Bahamians | 2.3 /100 | #233 | Tragic 12.2% |
| Japanese | 2.3 /100 | #234 | Tragic 12.2% |
| Yup'ik | 2.2 /100 | #235 | Tragic 12.2% |
| Chinese | 2.0 /100 | #236 | Tragic 12.2% |
| Immigrants | Congo | 1.9 /100 | #237 | Tragic 12.2% |
| Norwegians | 1.9 /100 | #238 | Tragic 12.2% |
| Swedes | 1.8 /100 | #239 | Tragic 12.2% |
| Hungarians | 1.7 /100 | #240 | Tragic 12.2% |
| Yugoslavians | 1.7 /100 | #241 | Tragic 12.2% |
| Poles | 1.7 /100 | #242 | Tragic 12.2% |
| British | 1.5 /100 | #243 | Tragic 12.2% |
Demographics Similar to Puget Sound Salish by Disability
In terms of disability, the demographic groups most similar to Puget Sound Salish are Black/African American (13.7%, a difference of 0.0%), Pima (13.7%, a difference of 0.030%), Immigrants from Cabo Verde (13.7%, a difference of 0.030%), Cree (13.7%, a difference of 0.040%), and Spanish American (13.6%, a difference of 0.39%).
| Demographics | Rating | Rank | Disability |
| French American Indians | 0.0 /100 | #308 | Tragic 13.5% |
| Tlingit-Haida | 0.0 /100 | #309 | Tragic 13.5% |
| Blackfeet | 0.0 /100 | #310 | Tragic 13.6% |
| Delaware | 0.0 /100 | #311 | Tragic 13.6% |
| Spanish Americans | 0.0 /100 | #312 | Tragic 13.6% |
| Cree | 0.0 /100 | #313 | Tragic 13.7% |
| Blacks/African Americans | 0.0 /100 | #314 | Tragic 13.7% |
| Puget Sound Salish | 0.0 /100 | #315 | Tragic 13.7% |
| Pima | 0.0 /100 | #316 | Tragic 13.7% |
| Immigrants | Cabo Verde | 0.0 /100 | #317 | Tragic 13.7% |
| Menominee | 0.0 /100 | #318 | Tragic 13.8% |
| Iroquois | 0.0 /100 | #319 | Tragic 13.8% |
| Apache | 0.0 /100 | #320 | Tragic 13.9% |
| Paiute | 0.0 /100 | #321 | Tragic 13.9% |
| Americans | 0.0 /100 | #322 | Tragic 13.9% |