Immigrants from England vs Puget Sound Salish Disability
COMPARE
Immigrants from England
Puget Sound Salish
Disability
Disability Comparison
Immigrants from England
Puget Sound Salish
12.0%
DISABILITY
12.0/ 100
METRIC RATING
202nd/ 347
METRIC RANK
13.7%
DISABILITY
0.0/ 100
METRIC RATING
315th/ 347
METRIC RANK
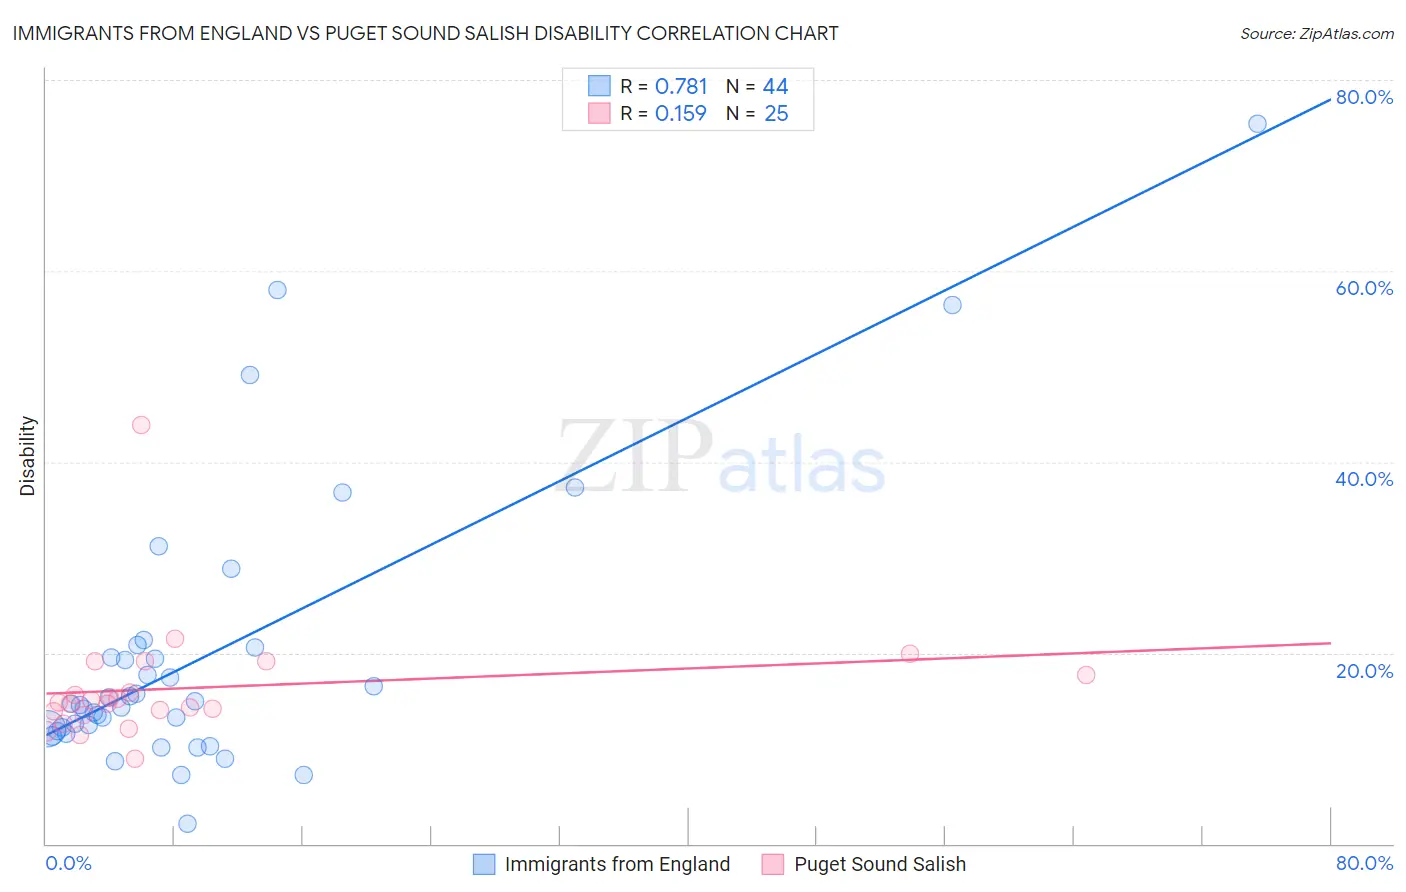
Immigrants from England vs Puget Sound Salish Disability Correlation Chart
The statistical analysis conducted on geographies consisting of 391,892,712 people shows a strong positive correlation between the proportion of Immigrants from England and percentage of population with a disability in the United States with a correlation coefficient (R) of 0.781 and weighted average of 12.0%. Similarly, the statistical analysis conducted on geographies consisting of 46,152,398 people shows a poor positive correlation between the proportion of Puget Sound Salish and percentage of population with a disability in the United States with a correlation coefficient (R) of 0.159 and weighted average of 13.7%, a difference of 14.6%.
Disability Correlation Summary
| Measurement | Immigrants from England | Puget Sound Salish |
| Minimum | 2.1% | 8.9% |
| Maximum | 75.4% | 43.9% |
| Range | 73.3% | 35.0% |
| Mean | 19.7% | 16.3% |
| Median | 14.6% | 14.8% |
| Interquartile 25% (IQ1) | 11.9% | 13.7% |
| Interquartile 75% (IQ3) | 20.1% | 18.4% |
| Interquartile Range (IQR) | 8.1% | 4.7% |
| Standard Deviation (Sample) | 14.9% | 6.4% |
| Standard Deviation (Population) | 14.7% | 6.3% |
Similar Demographics by Disability
Demographics Similar to Immigrants from England by Disability
In terms of disability, the demographic groups most similar to Immigrants from England are British West Indian (12.0%, a difference of 0.050%), Mexican American Indian (12.0%, a difference of 0.050%), Assyrian/Chaldean/Syriac (11.9%, a difference of 0.070%), Belizean (11.9%, a difference of 0.090%), and Immigrants from Western Europe (12.0%, a difference of 0.21%).
| Demographics | Rating | Rank | Disability |
| Barbadians | 15.8 /100 | #195 | Poor 11.9% |
| Serbians | 15.4 /100 | #196 | Poor 11.9% |
| Immigrants | Belize | 15.2 /100 | #197 | Poor 11.9% |
| Ukrainians | 14.7 /100 | #198 | Poor 11.9% |
| Immigrants | Panama | 14.6 /100 | #199 | Poor 11.9% |
| Belizeans | 12.8 /100 | #200 | Poor 11.9% |
| Assyrians/Chaldeans/Syriacs | 12.6 /100 | #201 | Poor 11.9% |
| Immigrants | England | 12.0 /100 | #202 | Poor 12.0% |
| British West Indians | 11.5 /100 | #203 | Poor 12.0% |
| Mexican American Indians | 11.4 /100 | #204 | Poor 12.0% |
| Immigrants | Western Europe | 10.1 /100 | #205 | Poor 12.0% |
| Immigrants | Senegal | 9.4 /100 | #206 | Tragic 12.0% |
| Immigrants | Thailand | 9.3 /100 | #207 | Tragic 12.0% |
| Immigrants | Caribbean | 9.1 /100 | #208 | Tragic 12.0% |
| Danes | 8.7 /100 | #209 | Tragic 12.0% |
Demographics Similar to Puget Sound Salish by Disability
In terms of disability, the demographic groups most similar to Puget Sound Salish are Black/African American (13.7%, a difference of 0.0%), Pima (13.7%, a difference of 0.030%), Immigrants from Cabo Verde (13.7%, a difference of 0.030%), Cree (13.7%, a difference of 0.040%), and Spanish American (13.6%, a difference of 0.39%).
| Demographics | Rating | Rank | Disability |
| French American Indians | 0.0 /100 | #308 | Tragic 13.5% |
| Tlingit-Haida | 0.0 /100 | #309 | Tragic 13.5% |
| Blackfeet | 0.0 /100 | #310 | Tragic 13.6% |
| Delaware | 0.0 /100 | #311 | Tragic 13.6% |
| Spanish Americans | 0.0 /100 | #312 | Tragic 13.6% |
| Cree | 0.0 /100 | #313 | Tragic 13.7% |
| Blacks/African Americans | 0.0 /100 | #314 | Tragic 13.7% |
| Puget Sound Salish | 0.0 /100 | #315 | Tragic 13.7% |
| Pima | 0.0 /100 | #316 | Tragic 13.7% |
| Immigrants | Cabo Verde | 0.0 /100 | #317 | Tragic 13.7% |
| Menominee | 0.0 /100 | #318 | Tragic 13.8% |
| Iroquois | 0.0 /100 | #319 | Tragic 13.8% |
| Apache | 0.0 /100 | #320 | Tragic 13.9% |
| Paiute | 0.0 /100 | #321 | Tragic 13.9% |
| Americans | 0.0 /100 | #322 | Tragic 13.9% |