Chickasaw vs Puget Sound Salish Disability
COMPARE
Chickasaw
Puget Sound Salish
Disability
Disability Comparison
Chickasaw
Puget Sound Salish
15.2%
DISABILITY
0.0/ 100
METRIC RATING
339th/ 347
METRIC RANK
13.7%
DISABILITY
0.0/ 100
METRIC RATING
315th/ 347
METRIC RANK
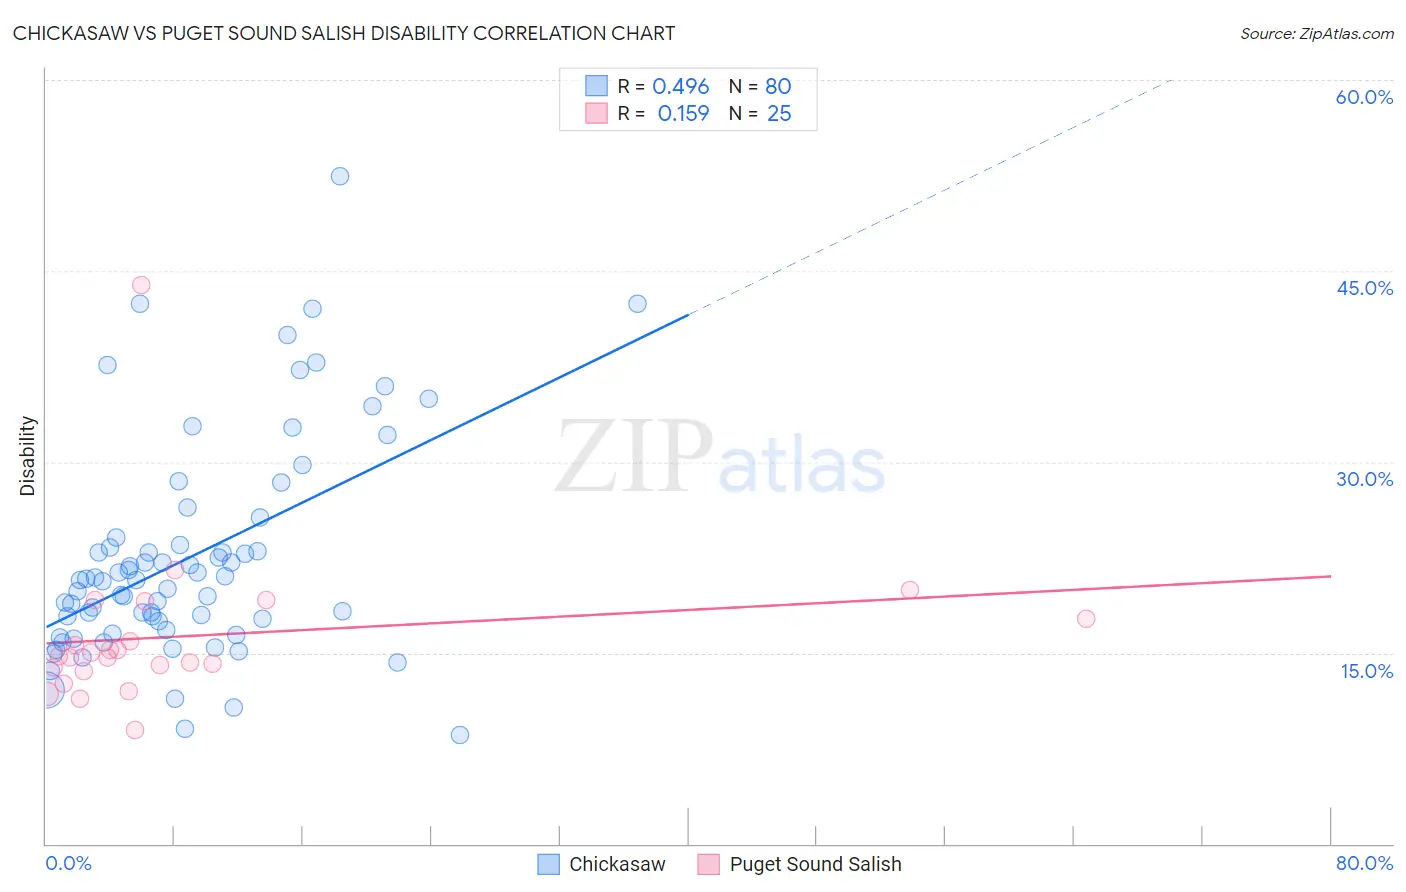
Chickasaw vs Puget Sound Salish Disability Correlation Chart
The statistical analysis conducted on geographies consisting of 147,689,192 people shows a moderate positive correlation between the proportion of Chickasaw and percentage of population with a disability in the United States with a correlation coefficient (R) of 0.496 and weighted average of 15.2%. Similarly, the statistical analysis conducted on geographies consisting of 46,152,398 people shows a poor positive correlation between the proportion of Puget Sound Salish and percentage of population with a disability in the United States with a correlation coefficient (R) of 0.159 and weighted average of 13.7%, a difference of 10.7%.
Disability Correlation Summary
| Measurement | Chickasaw | Puget Sound Salish |
| Minimum | 8.6% | 8.9% |
| Maximum | 52.4% | 43.9% |
| Range | 43.9% | 35.0% |
| Mean | 22.5% | 16.3% |
| Median | 20.7% | 14.8% |
| Interquartile 25% (IQ1) | 17.1% | 13.7% |
| Interquartile 75% (IQ3) | 23.7% | 18.4% |
| Interquartile Range (IQR) | 6.6% | 4.7% |
| Standard Deviation (Sample) | 8.6% | 6.4% |
| Standard Deviation (Population) | 8.5% | 6.3% |
Similar Demographics by Disability
Demographics Similar to Chickasaw by Disability
In terms of disability, the demographic groups most similar to Chickasaw are Choctaw (15.4%, a difference of 1.5%), Dutch West Indian (14.9%, a difference of 1.8%), Seminole (14.9%, a difference of 2.1%), Cherokee (14.8%, a difference of 2.2%), and Lumbee (15.5%, a difference of 2.3%).
| Demographics | Rating | Rank | Disability |
| Pueblo | 0.0 /100 | #332 | Tragic 14.4% |
| Cajuns | 0.0 /100 | #333 | Tragic 14.6% |
| Yuman | 0.0 /100 | #334 | Tragic 14.6% |
| Tohono O'odham | 0.0 /100 | #335 | Tragic 14.8% |
| Cherokee | 0.0 /100 | #336 | Tragic 14.8% |
| Seminole | 0.0 /100 | #337 | Tragic 14.9% |
| Dutch West Indians | 0.0 /100 | #338 | Tragic 14.9% |
| Chickasaw | 0.0 /100 | #339 | Tragic 15.2% |
| Choctaw | 0.0 /100 | #340 | Tragic 15.4% |
| Lumbee | 0.0 /100 | #341 | Tragic 15.5% |
| Kiowa | 0.0 /100 | #342 | Tragic 15.6% |
| Creek | 0.0 /100 | #343 | Tragic 15.6% |
| Colville | 0.0 /100 | #344 | Tragic 15.8% |
| Puerto Ricans | 0.0 /100 | #345 | Tragic 16.1% |
| Tsimshian | 0.0 /100 | #346 | Tragic 16.1% |
Demographics Similar to Puget Sound Salish by Disability
In terms of disability, the demographic groups most similar to Puget Sound Salish are Black/African American (13.7%, a difference of 0.0%), Pima (13.7%, a difference of 0.030%), Immigrants from Cabo Verde (13.7%, a difference of 0.030%), Cree (13.7%, a difference of 0.040%), and Spanish American (13.6%, a difference of 0.39%).
| Demographics | Rating | Rank | Disability |
| French American Indians | 0.0 /100 | #308 | Tragic 13.5% |
| Tlingit-Haida | 0.0 /100 | #309 | Tragic 13.5% |
| Blackfeet | 0.0 /100 | #310 | Tragic 13.6% |
| Delaware | 0.0 /100 | #311 | Tragic 13.6% |
| Spanish Americans | 0.0 /100 | #312 | Tragic 13.6% |
| Cree | 0.0 /100 | #313 | Tragic 13.7% |
| Blacks/African Americans | 0.0 /100 | #314 | Tragic 13.7% |
| Puget Sound Salish | 0.0 /100 | #315 | Tragic 13.7% |
| Pima | 0.0 /100 | #316 | Tragic 13.7% |
| Immigrants | Cabo Verde | 0.0 /100 | #317 | Tragic 13.7% |
| Menominee | 0.0 /100 | #318 | Tragic 13.8% |
| Iroquois | 0.0 /100 | #319 | Tragic 13.8% |
| Apache | 0.0 /100 | #320 | Tragic 13.9% |
| Paiute | 0.0 /100 | #321 | Tragic 13.9% |
| Americans | 0.0 /100 | #322 | Tragic 13.9% |