Immigrants from Grenada vs Greek Self-Care Disability
COMPARE
Immigrants from Grenada
Greek
Self-Care Disability
Self-Care Disability Comparison
Immigrants from Grenada
Greeks
2.8%
SELF-CARE DISABILITY
0.0/ 100
METRIC RATING
308th/ 347
METRIC RANK
2.4%
SELF-CARE DISABILITY
94.1/ 100
METRIC RATING
108th/ 347
METRIC RANK
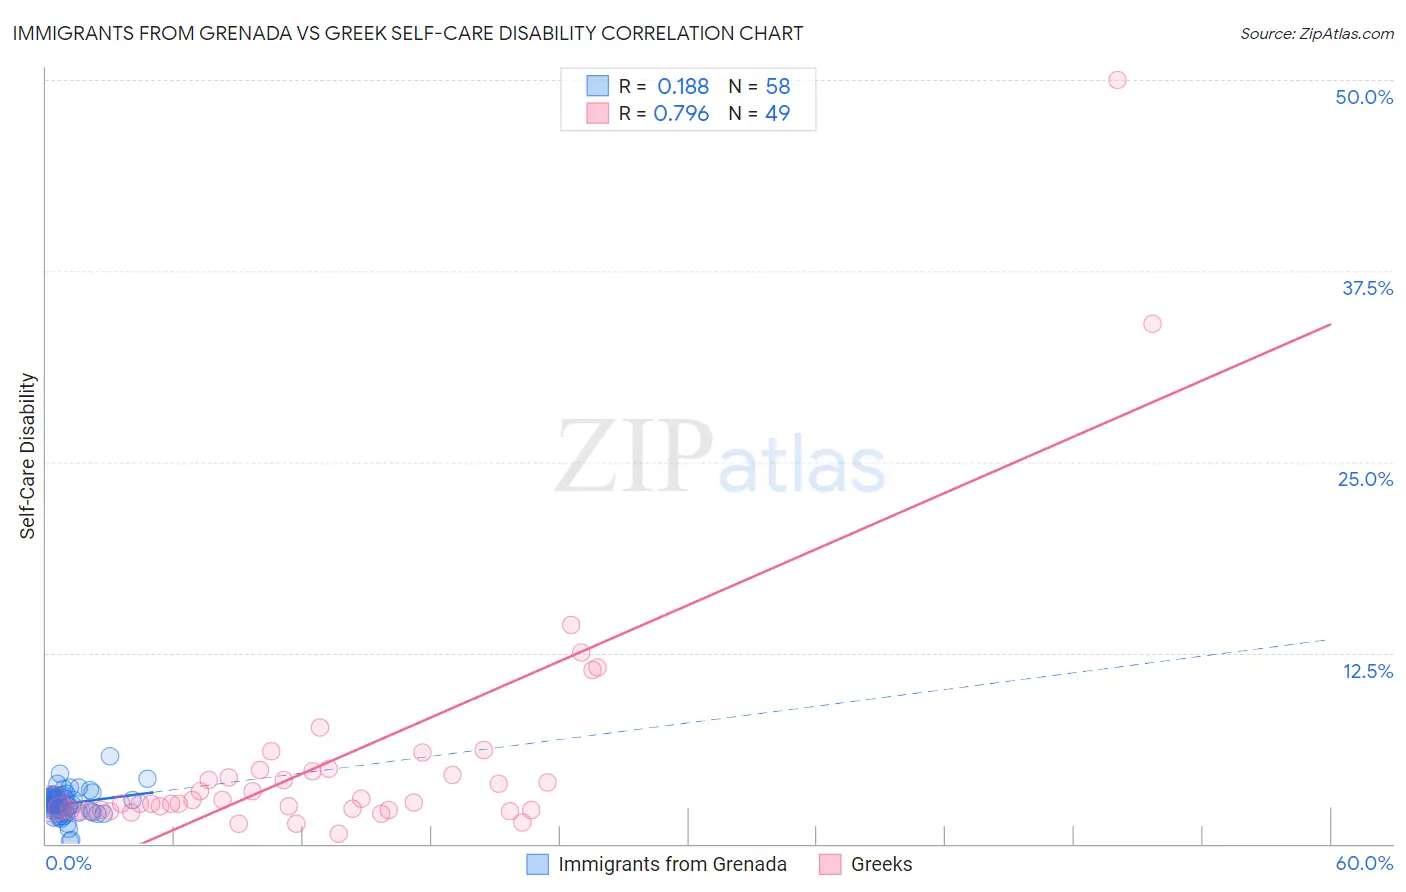
Immigrants from Grenada vs Greek Self-Care Disability Correlation Chart
The statistical analysis conducted on geographies consisting of 67,173,864 people shows a poor positive correlation between the proportion of Immigrants from Grenada and percentage of population with self-care disability in the United States with a correlation coefficient (R) of 0.188 and weighted average of 2.8%. Similarly, the statistical analysis conducted on geographies consisting of 481,876,170 people shows a strong positive correlation between the proportion of Greeks and percentage of population with self-care disability in the United States with a correlation coefficient (R) of 0.796 and weighted average of 2.4%, a difference of 18.0%.
Self-Care Disability Correlation Summary
| Measurement | Immigrants from Grenada | Greek |
| Minimum | 0.16% | 0.63% |
| Maximum | 5.7% | 50.0% |
| Range | 5.6% | 49.4% |
| Mean | 2.6% | 5.5% |
| Median | 2.6% | 2.7% |
| Interquartile 25% (IQ1) | 2.1% | 2.2% |
| Interquartile 75% (IQ3) | 3.1% | 4.8% |
| Interquartile Range (IQR) | 1.0% | 2.6% |
| Standard Deviation (Sample) | 0.92% | 8.3% |
| Standard Deviation (Population) | 0.92% | 8.2% |
Similar Demographics by Self-Care Disability
Demographics Similar to Immigrants from Grenada by Self-Care Disability
In terms of self-care disability, the demographic groups most similar to Immigrants from Grenada are Bangladeshi (2.8%, a difference of 0.15%), British West Indian (2.8%, a difference of 0.25%), Native/Alaskan (2.8%, a difference of 0.30%), Puget Sound Salish (2.8%, a difference of 0.32%), and Aleut (2.8%, a difference of 0.37%).
| Demographics | Rating | Rank | Self-Care Disability |
| Pima | 0.0 /100 | #301 | Tragic 2.8% |
| Immigrants | St. Vincent and the Grenadines | 0.0 /100 | #302 | Tragic 2.8% |
| Immigrants | Belize | 0.0 /100 | #303 | Tragic 2.8% |
| Cree | 0.0 /100 | #304 | Tragic 2.8% |
| Immigrants | West Indies | 0.0 /100 | #305 | Tragic 2.8% |
| Aleuts | 0.0 /100 | #306 | Tragic 2.8% |
| Natives/Alaskans | 0.0 /100 | #307 | Tragic 2.8% |
| Immigrants | Grenada | 0.0 /100 | #308 | Tragic 2.8% |
| Bangladeshis | 0.0 /100 | #309 | Tragic 2.8% |
| British West Indians | 0.0 /100 | #310 | Tragic 2.8% |
| Puget Sound Salish | 0.0 /100 | #311 | Tragic 2.8% |
| Immigrants | Caribbean | 0.0 /100 | #312 | Tragic 2.8% |
| Spanish Americans | 0.0 /100 | #313 | Tragic 2.8% |
| Creek | 0.0 /100 | #314 | Tragic 2.8% |
| Immigrants | Cuba | 0.0 /100 | #315 | Tragic 2.8% |
Demographics Similar to Greeks by Self-Care Disability
In terms of self-care disability, the demographic groups most similar to Greeks are Slovene (2.4%, a difference of 0.010%), British (2.4%, a difference of 0.030%), Immigrants from Indonesia (2.4%, a difference of 0.040%), Carpatho Rusyn (2.4%, a difference of 0.050%), and Bhutanese (2.4%, a difference of 0.080%).
| Demographics | Rating | Rank | Self-Care Disability |
| Immigrants | Scotland | 95.7 /100 | #101 | Exceptional 2.4% |
| Croatians | 95.0 /100 | #102 | Exceptional 2.4% |
| Alsatians | 94.9 /100 | #103 | Exceptional 2.4% |
| Bhutanese | 94.5 /100 | #104 | Exceptional 2.4% |
| Carpatho Rusyns | 94.4 /100 | #105 | Exceptional 2.4% |
| Immigrants | Indonesia | 94.3 /100 | #106 | Exceptional 2.4% |
| British | 94.3 /100 | #107 | Exceptional 2.4% |
| Greeks | 94.1 /100 | #108 | Exceptional 2.4% |
| Slovenes | 94.1 /100 | #109 | Exceptional 2.4% |
| Immigrants | Africa | 93.7 /100 | #110 | Exceptional 2.4% |
| Serbians | 93.6 /100 | #111 | Exceptional 2.4% |
| Scandinavians | 93.5 /100 | #112 | Exceptional 2.4% |
| South Americans | 93.2 /100 | #113 | Exceptional 2.4% |
| Immigrants | North Macedonia | 93.1 /100 | #114 | Exceptional 2.4% |
| Immigrants | Hong Kong | 93.1 /100 | #115 | Exceptional 2.4% |