Immigrants from Jordan vs Bolivian Self-Care Disability
COMPARE
Immigrants from Jordan
Bolivian
Self-Care Disability
Self-Care Disability Comparison
Immigrants from Jordan
Bolivians
2.4%
SELF-CARE DISABILITY
97.7/ 100
METRIC RATING
91st/ 347
METRIC RANK
2.2%
SELF-CARE DISABILITY
100.0/ 100
METRIC RATING
8th/ 347
METRIC RANK
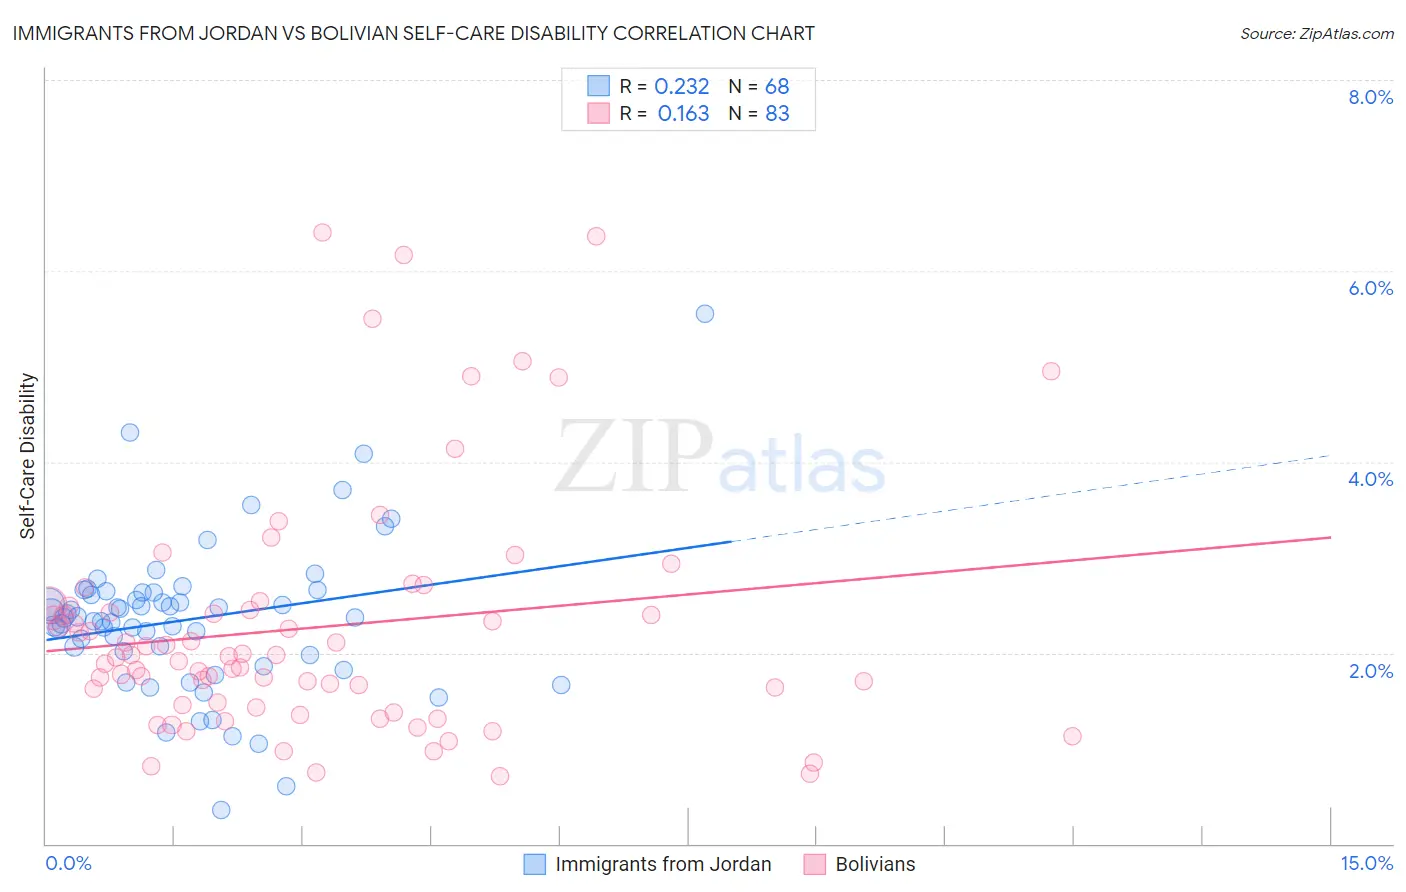
Immigrants from Jordan vs Bolivian Self-Care Disability Correlation Chart
The statistical analysis conducted on geographies consisting of 181,224,885 people shows a weak positive correlation between the proportion of Immigrants from Jordan and percentage of population with self-care disability in the United States with a correlation coefficient (R) of 0.232 and weighted average of 2.4%. Similarly, the statistical analysis conducted on geographies consisting of 184,600,652 people shows a poor positive correlation between the proportion of Bolivians and percentage of population with self-care disability in the United States with a correlation coefficient (R) of 0.163 and weighted average of 2.2%, a difference of 9.0%.
Self-Care Disability Correlation Summary
| Measurement | Immigrants from Jordan | Bolivian |
| Minimum | 0.35% | 0.71% |
| Maximum | 5.6% | 6.4% |
| Range | 5.2% | 5.7% |
| Mean | 2.4% | 2.3% |
| Median | 2.4% | 2.0% |
| Interquartile 25% (IQ1) | 2.0% | 1.5% |
| Interquartile 75% (IQ3) | 2.6% | 2.5% |
| Interquartile Range (IQR) | 0.64% | 1.0% |
| Standard Deviation (Sample) | 0.80% | 1.3% |
| Standard Deviation (Population) | 0.80% | 1.3% |
Similar Demographics by Self-Care Disability
Demographics Similar to Immigrants from Jordan by Self-Care Disability
In terms of self-care disability, the demographic groups most similar to Immigrants from Jordan are Immigrants from Czechoslovakia (2.4%, a difference of 0.010%), Icelander (2.4%, a difference of 0.14%), Immigrants from Congo (2.4%, a difference of 0.15%), Sierra Leonean (2.4%, a difference of 0.20%), and Lithuanian (2.4%, a difference of 0.20%).
| Demographics | Rating | Rank | Self-Care Disability |
| Immigrants | Spain | 98.7 /100 | #84 | Exceptional 2.3% |
| Estonians | 98.3 /100 | #85 | Exceptional 2.3% |
| Immigrants | Northern Africa | 98.2 /100 | #86 | Exceptional 2.3% |
| Sierra Leoneans | 98.0 /100 | #87 | Exceptional 2.4% |
| Lithuanians | 98.0 /100 | #88 | Exceptional 2.4% |
| Immigrants | Congo | 98.0 /100 | #89 | Exceptional 2.4% |
| Immigrants | Czechoslovakia | 97.7 /100 | #90 | Exceptional 2.4% |
| Immigrants | Jordan | 97.7 /100 | #91 | Exceptional 2.4% |
| Icelanders | 97.4 /100 | #92 | Exceptional 2.4% |
| Immigrants | Latvia | 97.0 /100 | #93 | Exceptional 2.4% |
| Macedonians | 96.9 /100 | #94 | Exceptional 2.4% |
| Immigrants | Asia | 96.9 /100 | #95 | Exceptional 2.4% |
| Immigrants | Chile | 96.7 /100 | #96 | Exceptional 2.4% |
| Swiss | 96.6 /100 | #97 | Exceptional 2.4% |
| Immigrants | Poland | 96.4 /100 | #98 | Exceptional 2.4% |
Demographics Similar to Bolivians by Self-Care Disability
In terms of self-care disability, the demographic groups most similar to Bolivians are Immigrants from Bolivia (2.2%, a difference of 0.050%), Immigrants from Nepal (2.2%, a difference of 0.14%), Filipino (2.2%, a difference of 0.26%), Zimbabwean (2.2%, a difference of 0.51%), and Sudanese (2.2%, a difference of 1.4%).
| Demographics | Rating | Rank | Self-Care Disability |
| Yup'ik | 100.0 /100 | #1 | Exceptional 1.9% |
| Immigrants | India | 100.0 /100 | #2 | Exceptional 2.0% |
| Thais | 100.0 /100 | #3 | Exceptional 2.1% |
| Immigrants | Singapore | 100.0 /100 | #4 | Exceptional 2.1% |
| Zimbabweans | 100.0 /100 | #5 | Exceptional 2.2% |
| Filipinos | 100.0 /100 | #6 | Exceptional 2.2% |
| Immigrants | Bolivia | 100.0 /100 | #7 | Exceptional 2.2% |
| Bolivians | 100.0 /100 | #8 | Exceptional 2.2% |
| Immigrants | Nepal | 100.0 /100 | #9 | Exceptional 2.2% |
| Sudanese | 100.0 /100 | #10 | Exceptional 2.2% |
| Immigrants | South Central Asia | 100.0 /100 | #11 | Exceptional 2.2% |
| Immigrants | Ethiopia | 100.0 /100 | #12 | Exceptional 2.2% |
| Ethiopians | 100.0 /100 | #13 | Exceptional 2.2% |
| Luxembourgers | 100.0 /100 | #14 | Exceptional 2.2% |
| Okinawans | 100.0 /100 | #15 | Exceptional 2.2% |