Immigrants from Belgium vs Immigrants from Netherlands Disability
COMPARE
Immigrants from Belgium
Immigrants from Netherlands
Disability
Disability Comparison
Immigrants from Belgium
Immigrants from Netherlands
11.0%
DISABILITY
99.3/ 100
METRIC RATING
77th/ 347
METRIC RANK
11.6%
DISABILITY
69.8/ 100
METRIC RATING
155th/ 347
METRIC RANK
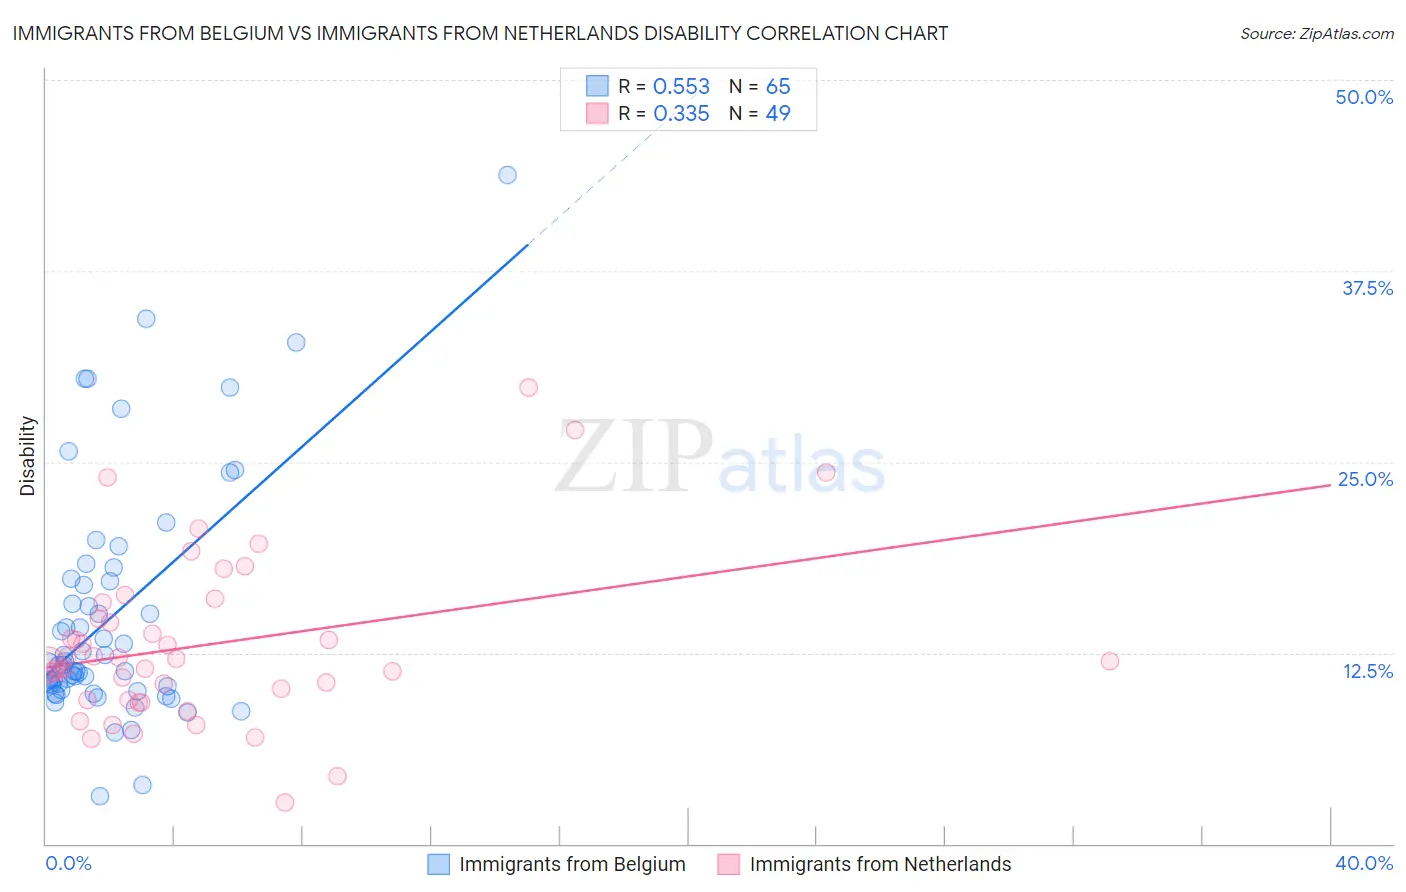
Immigrants from Belgium vs Immigrants from Netherlands Disability Correlation Chart
The statistical analysis conducted on geographies consisting of 146,717,814 people shows a substantial positive correlation between the proportion of Immigrants from Belgium and percentage of population with a disability in the United States with a correlation coefficient (R) of 0.553 and weighted average of 11.0%. Similarly, the statistical analysis conducted on geographies consisting of 237,881,665 people shows a mild positive correlation between the proportion of Immigrants from Netherlands and percentage of population with a disability in the United States with a correlation coefficient (R) of 0.335 and weighted average of 11.6%, a difference of 4.9%.
Disability Correlation Summary
| Measurement | Immigrants from Belgium | Immigrants from Netherlands |
| Minimum | 3.1% | 2.7% |
| Maximum | 43.8% | 29.8% |
| Range | 40.7% | 27.1% |
| Mean | 14.9% | 13.0% |
| Median | 11.7% | 12.0% |
| Interquartile 25% (IQ1) | 10.2% | 9.4% |
| Interquartile 75% (IQ3) | 17.3% | 15.3% |
| Interquartile Range (IQR) | 7.1% | 5.9% |
| Standard Deviation (Sample) | 7.8% | 5.5% |
| Standard Deviation (Population) | 7.7% | 5.4% |
Similar Demographics by Disability
Demographics Similar to Immigrants from Belgium by Disability
In terms of disability, the demographic groups most similar to Immigrants from Belgium are Sierra Leonean (11.0%, a difference of 0.0%), Immigrants from Vietnam (11.0%, a difference of 0.030%), Immigrants from Cameroon (11.1%, a difference of 0.040%), Immigrants from Serbia (11.0%, a difference of 0.050%), and Immigrants from Bangladesh (11.0%, a difference of 0.070%).
| Demographics | Rating | Rank | Disability |
| Immigrants | France | 99.4 /100 | #70 | Exceptional 11.0% |
| Immigrants | Lebanon | 99.4 /100 | #71 | Exceptional 11.0% |
| Immigrants | Chile | 99.4 /100 | #72 | Exceptional 11.0% |
| Immigrants | Bangladesh | 99.4 /100 | #73 | Exceptional 11.0% |
| Immigrants | Serbia | 99.4 /100 | #74 | Exceptional 11.0% |
| Immigrants | Vietnam | 99.4 /100 | #75 | Exceptional 11.0% |
| Sierra Leoneans | 99.3 /100 | #76 | Exceptional 11.0% |
| Immigrants | Belgium | 99.3 /100 | #77 | Exceptional 11.0% |
| Immigrants | Cameroon | 99.3 /100 | #78 | Exceptional 11.1% |
| Immigrants | Jordan | 99.3 /100 | #79 | Exceptional 11.1% |
| Immigrants | Ireland | 99.3 /100 | #80 | Exceptional 11.1% |
| Immigrants | Poland | 99.1 /100 | #81 | Exceptional 11.1% |
| Chileans | 99.1 /100 | #82 | Exceptional 11.1% |
| Immigrants | Switzerland | 99.0 /100 | #83 | Exceptional 11.1% |
| Immigrants | Sierra Leone | 99.0 /100 | #84 | Exceptional 11.1% |
Demographics Similar to Immigrants from Netherlands by Disability
In terms of disability, the demographic groups most similar to Immigrants from Netherlands are Immigrants from Fiji (11.6%, a difference of 0.010%), Immigrants from Middle Africa (11.6%, a difference of 0.020%), Immigrants from Guatemala (11.6%, a difference of 0.070%), Immigrants from Ghana (11.6%, a difference of 0.080%), and Immigrants from Moldova (11.6%, a difference of 0.12%).
| Demographics | Rating | Rank | Disability |
| Sudanese | 77.1 /100 | #148 | Good 11.5% |
| Immigrants | Norway | 73.2 /100 | #149 | Good 11.6% |
| Romanians | 72.7 /100 | #150 | Good 11.6% |
| Immigrants | Kenya | 72.1 /100 | #151 | Good 11.6% |
| Immigrants | Moldova | 72.0 /100 | #152 | Good 11.6% |
| Immigrants | Ghana | 71.2 /100 | #153 | Good 11.6% |
| Immigrants | Guatemala | 71.1 /100 | #154 | Good 11.6% |
| Immigrants | Netherlands | 69.8 /100 | #155 | Good 11.6% |
| Immigrants | Fiji | 69.5 /100 | #156 | Good 11.6% |
| Immigrants | Middle Africa | 69.5 /100 | #157 | Good 11.6% |
| Armenians | 65.9 /100 | #158 | Good 11.6% |
| Guatemalans | 65.1 /100 | #159 | Good 11.6% |
| Immigrants | Barbados | 64.2 /100 | #160 | Good 11.6% |
| Immigrants | Cuba | 62.8 /100 | #161 | Good 11.6% |
| Immigrants | Haiti | 59.2 /100 | #162 | Average 11.7% |