French Canadian vs Immigrants from Netherlands Disability
COMPARE
French Canadian
Immigrants from Netherlands
Disability
Disability Comparison
French Canadians
Immigrants from Netherlands
13.4%
DISABILITY
0.0/ 100
METRIC RATING
305th/ 347
METRIC RANK
11.6%
DISABILITY
69.8/ 100
METRIC RATING
155th/ 347
METRIC RANK
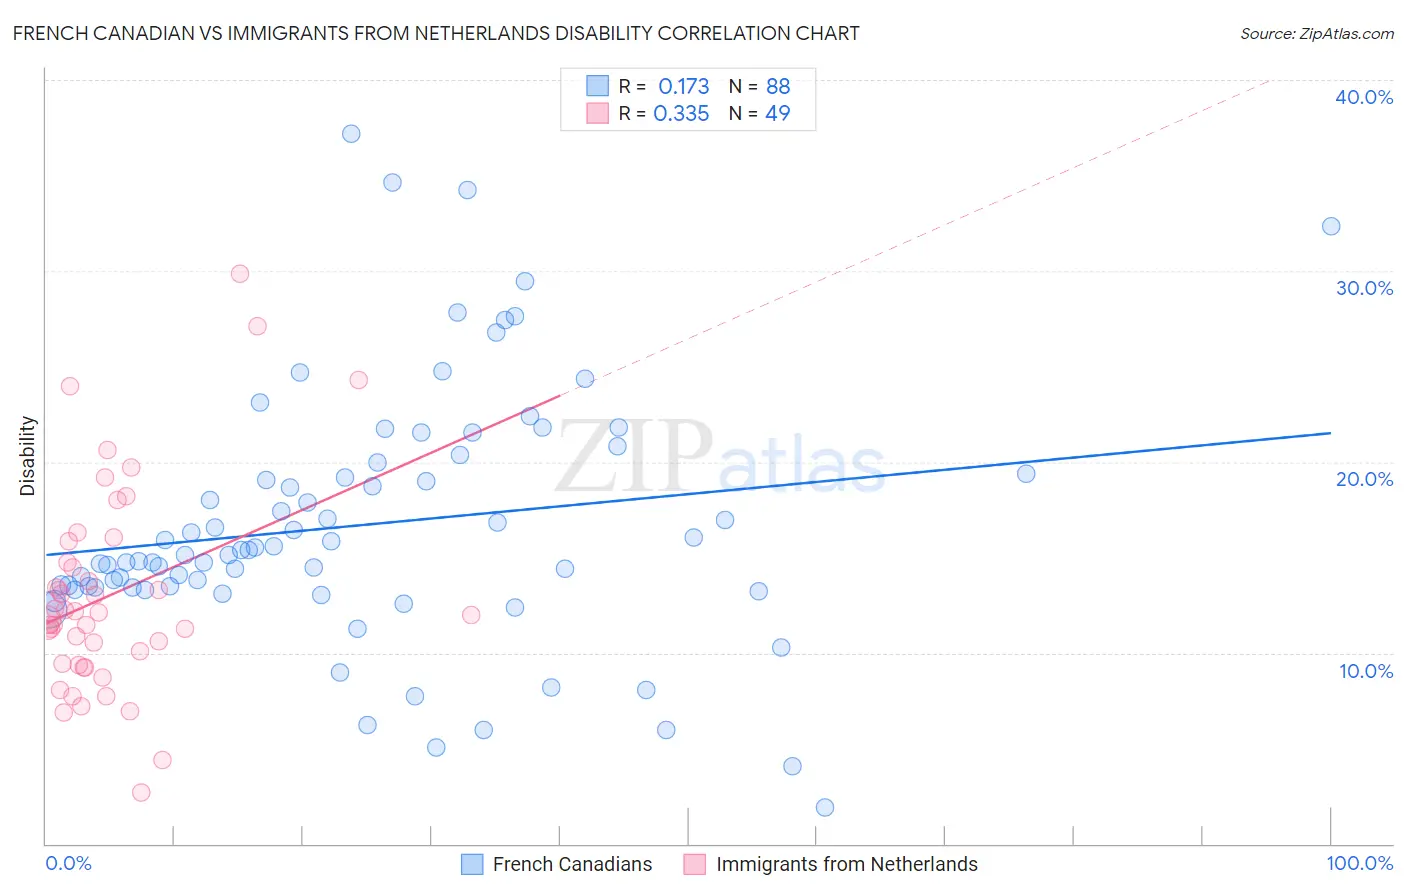
French Canadian vs Immigrants from Netherlands Disability Correlation Chart
The statistical analysis conducted on geographies consisting of 502,588,623 people shows a poor positive correlation between the proportion of French Canadians and percentage of population with a disability in the United States with a correlation coefficient (R) of 0.173 and weighted average of 13.4%. Similarly, the statistical analysis conducted on geographies consisting of 237,881,665 people shows a mild positive correlation between the proportion of Immigrants from Netherlands and percentage of population with a disability in the United States with a correlation coefficient (R) of 0.335 and weighted average of 11.6%, a difference of 15.8%.
Disability Correlation Summary
| Measurement | French Canadian | Immigrants from Netherlands |
| Minimum | 1.9% | 2.7% |
| Maximum | 37.2% | 29.8% |
| Range | 35.3% | 27.1% |
| Mean | 16.7% | 13.0% |
| Median | 15.3% | 12.0% |
| Interquartile 25% (IQ1) | 13.4% | 9.4% |
| Interquartile 75% (IQ3) | 19.7% | 15.3% |
| Interquartile Range (IQR) | 6.3% | 5.9% |
| Standard Deviation (Sample) | 6.7% | 5.5% |
| Standard Deviation (Population) | 6.6% | 5.4% |
Similar Demographics by Disability
Demographics Similar to French Canadians by Disability
In terms of disability, the demographic groups most similar to French Canadians are Yakama (13.4%, a difference of 0.35%), Cape Verdean (13.5%, a difference of 0.61%), Shoshone (13.5%, a difference of 0.66%), French American Indian (13.5%, a difference of 0.75%), and Scotch-Irish (13.3%, a difference of 0.81%).
| Demographics | Rating | Rank | Disability |
| Alaska Natives | 0.0 /100 | #298 | Tragic 13.2% |
| French | 0.0 /100 | #299 | Tragic 13.2% |
| Pennsylvania Germans | 0.0 /100 | #300 | Tragic 13.2% |
| Immigrants | Micronesia | 0.0 /100 | #301 | Tragic 13.2% |
| Arapaho | 0.0 /100 | #302 | Tragic 13.2% |
| Scotch-Irish | 0.0 /100 | #303 | Tragic 13.3% |
| Yakama | 0.0 /100 | #304 | Tragic 13.4% |
| French Canadians | 0.0 /100 | #305 | Tragic 13.4% |
| Cape Verdeans | 0.0 /100 | #306 | Tragic 13.5% |
| Shoshone | 0.0 /100 | #307 | Tragic 13.5% |
| French American Indians | 0.0 /100 | #308 | Tragic 13.5% |
| Tlingit-Haida | 0.0 /100 | #309 | Tragic 13.5% |
| Blackfeet | 0.0 /100 | #310 | Tragic 13.6% |
| Delaware | 0.0 /100 | #311 | Tragic 13.6% |
| Spanish Americans | 0.0 /100 | #312 | Tragic 13.6% |
Demographics Similar to Immigrants from Netherlands by Disability
In terms of disability, the demographic groups most similar to Immigrants from Netherlands are Immigrants from Fiji (11.6%, a difference of 0.010%), Immigrants from Middle Africa (11.6%, a difference of 0.020%), Immigrants from Guatemala (11.6%, a difference of 0.070%), Immigrants from Ghana (11.6%, a difference of 0.080%), and Immigrants from Moldova (11.6%, a difference of 0.12%).
| Demographics | Rating | Rank | Disability |
| Sudanese | 77.1 /100 | #148 | Good 11.5% |
| Immigrants | Norway | 73.2 /100 | #149 | Good 11.6% |
| Romanians | 72.7 /100 | #150 | Good 11.6% |
| Immigrants | Kenya | 72.1 /100 | #151 | Good 11.6% |
| Immigrants | Moldova | 72.0 /100 | #152 | Good 11.6% |
| Immigrants | Ghana | 71.2 /100 | #153 | Good 11.6% |
| Immigrants | Guatemala | 71.1 /100 | #154 | Good 11.6% |
| Immigrants | Netherlands | 69.8 /100 | #155 | Good 11.6% |
| Immigrants | Fiji | 69.5 /100 | #156 | Good 11.6% |
| Immigrants | Middle Africa | 69.5 /100 | #157 | Good 11.6% |
| Armenians | 65.9 /100 | #158 | Good 11.6% |
| Guatemalans | 65.1 /100 | #159 | Good 11.6% |
| Immigrants | Barbados | 64.2 /100 | #160 | Good 11.6% |
| Immigrants | Cuba | 62.8 /100 | #161 | Good 11.6% |
| Immigrants | Haiti | 59.2 /100 | #162 | Average 11.7% |