Immigrants from Jamaica vs Barbadian Male Disability
COMPARE
Immigrants from Jamaica
Barbadian
Male Disability
Male Disability Comparison
Immigrants from Jamaica
Barbadians
11.5%
MALE DISABILITY
16.3/ 100
METRIC RATING
198th/ 347
METRIC RANK
11.2%
MALE DISABILITY
53.4/ 100
METRIC RATING
169th/ 347
METRIC RANK
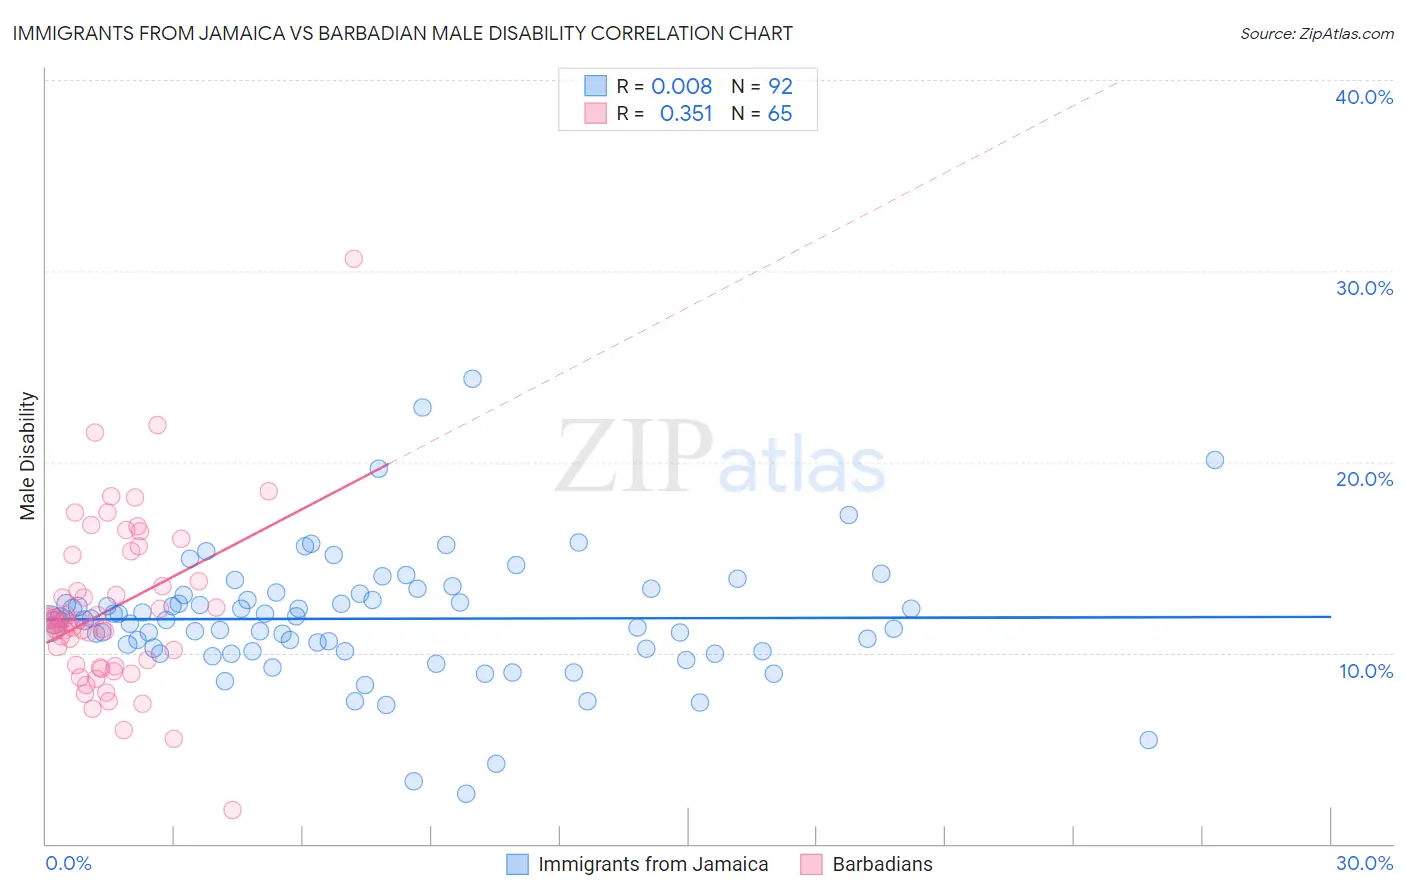
Immigrants from Jamaica vs Barbadian Male Disability Correlation Chart
The statistical analysis conducted on geographies consisting of 301,738,521 people shows no correlation between the proportion of Immigrants from Jamaica and percentage of males with a disability in the United States with a correlation coefficient (R) of 0.008 and weighted average of 11.5%. Similarly, the statistical analysis conducted on geographies consisting of 141,288,845 people shows a mild positive correlation between the proportion of Barbadians and percentage of males with a disability in the United States with a correlation coefficient (R) of 0.351 and weighted average of 11.2%, a difference of 2.5%.
Male Disability Correlation Summary
| Measurement | Immigrants from Jamaica | Barbadian |
| Minimum | 2.6% | 1.8% |
| Maximum | 24.3% | 30.6% |
| Range | 21.7% | 28.8% |
| Mean | 11.8% | 12.3% |
| Median | 11.7% | 11.6% |
| Interquartile 25% (IQ1) | 10.1% | 9.3% |
| Interquartile 75% (IQ3) | 13.1% | 14.4% |
| Interquartile Range (IQR) | 3.0% | 5.1% |
| Standard Deviation (Sample) | 3.4% | 4.4% |
| Standard Deviation (Population) | 3.3% | 4.4% |
Similar Demographics by Male Disability
Demographics Similar to Immigrants from Jamaica by Male Disability
In terms of male disability, the demographic groups most similar to Immigrants from Jamaica are Lebanese (11.5%, a difference of 0.090%), Somali (11.4%, a difference of 0.18%), West Indian (11.4%, a difference of 0.20%), Immigrants from Iraq (11.5%, a difference of 0.36%), and Immigrants from Panama (11.5%, a difference of 0.36%).
| Demographics | Rating | Rank | Male Disability |
| Senegalese | 23.2 /100 | #191 | Fair 11.4% |
| Assyrians/Chaldeans/Syriacs | 23.2 /100 | #192 | Fair 11.4% |
| Greeks | 22.2 /100 | #193 | Fair 11.4% |
| Belizeans | 21.2 /100 | #194 | Fair 11.4% |
| Immigrants | Oceania | 20.9 /100 | #195 | Fair 11.4% |
| West Indians | 18.4 /100 | #196 | Poor 11.4% |
| Somalis | 18.2 /100 | #197 | Poor 11.4% |
| Immigrants | Jamaica | 16.3 /100 | #198 | Poor 11.5% |
| Lebanese | 15.4 /100 | #199 | Poor 11.5% |
| Immigrants | Iraq | 13.0 /100 | #200 | Poor 11.5% |
| Immigrants | Panama | 13.0 /100 | #201 | Poor 11.5% |
| Immigrants | Mexico | 12.6 /100 | #202 | Poor 11.5% |
| Jamaicans | 10.9 /100 | #203 | Poor 11.5% |
| Immigrants | Cambodia | 10.8 /100 | #204 | Poor 11.5% |
| Serbians | 10.7 /100 | #205 | Poor 11.5% |
Demographics Similar to Barbadians by Male Disability
In terms of male disability, the demographic groups most similar to Barbadians are Immigrants from Latin America (11.2%, a difference of 0.030%), New Zealander (11.2%, a difference of 0.030%), Haitian (11.2%, a difference of 0.050%), Immigrants from Southern Europe (11.2%, a difference of 0.060%), and Romanian (11.2%, a difference of 0.15%).
| Demographics | Rating | Rank | Male Disability |
| Immigrants | Haiti | 65.3 /100 | #162 | Good 11.1% |
| Immigrants | Kenya | 63.8 /100 | #163 | Good 11.1% |
| British West Indians | 62.8 /100 | #164 | Good 11.1% |
| Luxembourgers | 61.9 /100 | #165 | Good 11.1% |
| Immigrants | Hungary | 61.2 /100 | #166 | Good 11.1% |
| Immigrants | Southern Europe | 54.4 /100 | #167 | Average 11.2% |
| Immigrants | Latin America | 54.0 /100 | #168 | Average 11.2% |
| Barbadians | 53.4 /100 | #169 | Average 11.2% |
| New Zealanders | 52.9 /100 | #170 | Average 11.2% |
| Haitians | 52.5 /100 | #171 | Average 11.2% |
| Romanians | 50.7 /100 | #172 | Average 11.2% |
| Immigrants | Burma/Myanmar | 50.4 /100 | #173 | Average 11.2% |
| Maltese | 50.0 /100 | #174 | Average 11.2% |
| Immigrants | Honduras | 48.7 /100 | #175 | Average 11.2% |
| Syrians | 46.6 /100 | #176 | Average 11.2% |