Immigrants from Ireland vs Immigrants from Nigeria Disability

COMPARE

Immigrants from Ireland
Race
Ancestry
AfghanAfricanAlaska NativeAlaskan AthabascanAlbanianAleutAlsatianAmericanApacheArabArapahoArgentineanArmenianAssyrian/Chaldean/SyriacAustralianAustrianBahamianBangladeshiBarbadianBasqueBelgianBelizeanBermudanBhutaneseBlackfeetBolivianBrazilianBritishBritish West IndianBulgarianBurmeseCajunCambodianCanadianCape VerdeanCarpatho RusynCelticCentral AmericanCentral American IndianCherokeeCheyenneChickasawChileanChineseChippewaChoctawColombianColvilleComancheCosta RicanCreeCreekCroatianCrowCubanCypriotCzechCzechoslovakianDanishDelawareDominicanDutchDutch West IndianEastern EuropeanEcuadorianEgyptianEnglishEstonianEthiopianEuropeanFijianFilipinoFinnishFrenchFrench American IndianFrench CanadianGermanGerman RussianGhanaianGreekGuamanian/ChamorroGuatemalanGuyaneseHaitianHmongHonduranHopiHoumaHungarianIcelanderIndian (Asian)IndonesianInupiatIranianIraqiIrishIroquoisIsraeliItalianJamaicanJapaneseJordanianKenyanKiowaKoreanLaotianLatvianLebaneseLiberianLithuanianLumbeeLuxembourgerMacedonianMalaysianMalteseMarshalleseMenomineeMexicanMexican American IndianMongolianMoroccanNative HawaiianNavajoNepaleseNew ZealanderNicaraguanNigerianNorthern EuropeanNorwegianOkinawanOsageOttawaPaiutePakistaniPalestinianPanamanianParaguayanPennsylvania GermanPeruvianPimaPolishPortuguesePotawatomiPuebloPuerto RicanPuget Sound SalishRomanianRussianSalvadoranSamoanScandinavianScotch-IrishScottishSeminoleSenegaleseSerbianShoshoneSierra LeoneanSiouxSlavicSlovakSloveneSomaliSouth AfricanSouth AmericanSouth American IndianSoviet UnionSpaniardSpanishSpanish AmericanSpanish American IndianSri LankanSubsaharan AfricanSudaneseSwedishSwissSyrianTaiwaneseThaiTlingit-HaidaTohono O'OdhamTonganTrinidadian and TobagonianTsimshianTurkishU.S. Virgin IslanderUgandanUkrainianUruguayanUteVenezuelanVietnameseWelshWest IndianYakamaYaquiYugoslavianYumanYup'ikZimbabwean
Immigration
NonimmigrantsImmigrantsAfghanistanAfricaAlbaniaArgentinaArmeniaAsiaAustraliaAustriaBahamasBangladeshBarbadosBelarusBelgiumBelizeBoliviaBosnia and HerzegovinaBrazilBulgariaBurma/MyanmarCabo VerdeCambodiaCameroonCanadaCaribbeanCentral AmericaChileChinaColombiaCongoCosta RicaCroatiaCubaCzechoslovakiaDenmarkDominicaDominican RepublicEastern AfricaEastern AsiaEastern EuropeEcuadorEgyptEl SalvadorEnglandEritreaEthiopiaEuropeFijiFranceGermanyGhanaGreeceGrenadaGuatemalaGuyanaHaitiHondurasHong KongHungaryIndiaIndonesiaIranIraqIrelandIsraelItalyJamaicaJapanJordanKazakhstanKenyaKoreaKuwaitLaosLatin AmericaLatviaLebanonLiberiaLithuaniaMalaysiaMexicoMicronesiaMiddle AfricaMoldovaMoroccoNepalNetherlandsNicaraguaNorth AmericaNorth MacedoniaNorthern AfricaNorthern EuropeNorwayOceaniaPakistanPanamaPeruPhilippinesPolandPortugalRomaniaRussiaSaudi ArabiaScotlandSenegalSerbiaSierra LeoneSingaporeSomaliaSouth AfricaSouth AmericaSouth Central AsiaSouth Eastern AsiaSouthern EuropeSpainSri LankaSt. Vincent and the GrenadinesSudanSwedenSwitzerlandSyriaTaiwanThailandTrinidad and TobagoTurkeyUgandaUkraineUruguayUzbekistanVenezuelaVietnamWest IndiesWestern AfricaWestern AsiaWestern EuropeYemenZaireZimbabweAzores
Immigrants from Nigeria
Race
Ancestry
AfghanAfricanAlaska NativeAlaskan AthabascanAlbanianAleutAlsatianAmericanApacheArabArapahoArgentineanArmenianAssyrian/Chaldean/SyriacAustralianAustrianBahamianBangladeshiBarbadianBasqueBelgianBelizeanBermudanBhutaneseBlackfeetBolivianBrazilianBritishBritish West IndianBulgarianBurmeseCajunCambodianCanadianCape VerdeanCarpatho RusynCelticCentral AmericanCentral American IndianCherokeeCheyenneChickasawChileanChineseChippewaChoctawColombianColvilleComancheCosta RicanCreeCreekCroatianCrowCubanCypriotCzechCzechoslovakianDanishDelawareDominicanDutchDutch West IndianEastern EuropeanEcuadorianEgyptianEnglishEstonianEthiopianEuropeanFijianFilipinoFinnishFrenchFrench American IndianFrench CanadianGermanGerman RussianGhanaianGreekGuamanian/ChamorroGuatemalanGuyaneseHaitianHmongHonduranHopiHoumaHungarianIcelanderIndian (Asian)IndonesianInupiatIranianIraqiIrishIroquoisIsraeliItalianJamaicanJapaneseJordanianKenyanKiowaKoreanLaotianLatvianLebaneseLiberianLithuanianLumbeeLuxembourgerMacedonianMalaysianMalteseMarshalleseMenomineeMexicanMexican American IndianMongolianMoroccanNative HawaiianNavajoNepaleseNew ZealanderNicaraguanNigerianNorthern EuropeanNorwegianOkinawanOsageOttawaPaiutePakistaniPalestinianPanamanianParaguayanPennsylvania GermanPeruvianPimaPolishPortuguesePotawatomiPuebloPuerto RicanPuget Sound SalishRomanianRussianSalvadoranSamoanScandinavianScotch-IrishScottishSeminoleSenegaleseSerbianShoshoneSierra LeoneanSiouxSlavicSlovakSloveneSomaliSouth AfricanSouth AmericanSouth American IndianSoviet UnionSpaniardSpanishSpanish AmericanSpanish American IndianSri LankanSubsaharan AfricanSudaneseSwedishSwissSyrianTaiwaneseThaiTlingit-HaidaTohono O'OdhamTonganTrinidadian and TobagonianTsimshianTurkishU.S. Virgin IslanderUgandanUkrainianUruguayanUteVenezuelanVietnameseWelshWest IndianYakamaYaquiYugoslavianYumanYup'ikZimbabwean
Immigration
NonimmigrantsImmigrantsAfghanistanAfricaAlbaniaArgentinaArmeniaAsiaAustraliaAustriaBahamasBangladeshBarbadosBelarusBelgiumBelizeBoliviaBosnia and HerzegovinaBrazilBulgariaBurma/MyanmarCabo VerdeCambodiaCameroonCanadaCaribbeanCentral AmericaChileChinaColombiaCongoCosta RicaCroatiaCubaCzechoslovakiaDenmarkDominicaDominican RepublicEastern AfricaEastern AsiaEastern EuropeEcuadorEgyptEl SalvadorEnglandEritreaEthiopiaEuropeFijiFranceGermanyGhanaGreeceGrenadaGuatemalaGuyanaHaitiHondurasHong KongHungaryIndiaIndonesiaIranIraqIsraelItalyJamaicaJapanJordanKazakhstanKenyaKoreaKuwaitLaosLatin AmericaLatviaLebanonLiberiaLithuaniaMalaysiaMexicoMicronesiaMiddle AfricaMoldovaMoroccoNepalNetherlandsNicaraguaNigeriaNorth AmericaNorth MacedoniaNorthern AfricaNorthern EuropeNorwayOceaniaPakistanPanamaPeruPhilippinesPolandPortugalRomaniaRussiaSaudi ArabiaScotlandSenegalSerbiaSierra LeoneSingaporeSomaliaSouth AfricaSouth AmericaSouth Central AsiaSouth Eastern AsiaSouthern EuropeSpainSri LankaSt. Vincent and the GrenadinesSudanSwedenSwitzerlandSyriaTaiwanThailandTrinidad and TobagoTurkeyUgandaUkraineUruguayUzbekistanVenezuelaVietnamWest IndiesWestern AfricaWestern AsiaWestern EuropeYemenZaireZimbabweAzores
Disability
Income
Poverty
Unemployment
Labor Participation
Family Structure
Vehicle Availability
Education Level
Disability

Disability Comparison

Immigrants from Ireland

Immigrants from Nigeria

Exceptional
Exceptional
11.1%
DISABILITY
99.3/ 100
METRIC RATING
80th/ 347
METRIC RANK
11.3%
DISABILITY
96.0/ 100
METRIC RATING
108th/ 347
METRIC RANK

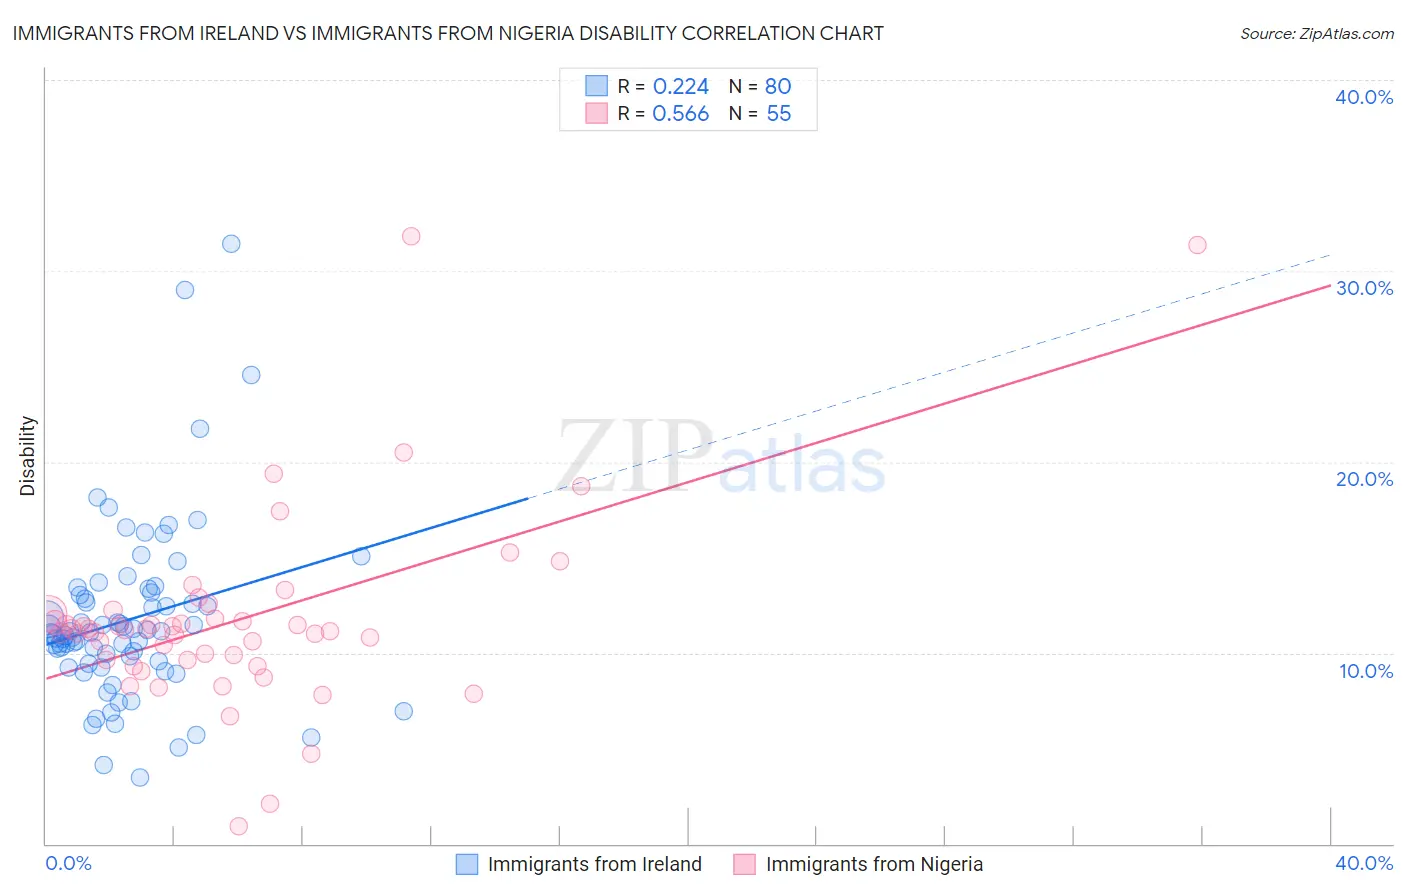
Immigrants from Ireland vs Immigrants from Nigeria Disability Correlation Chart

The statistical analysis conducted on geographies consisting of 240,775,613 people shows a weak positive correlation between the proportion of Immigrants from Ireland and percentage of population with a disability in the United States with a correlation coefficient (R) of 0.224 and weighted average of 11.1%. Similarly, the statistical analysis conducted on geographies consisting of 283,478,180 people shows a substantial positive correlation between the proportion of Immigrants from Nigeria and percentage of population with a disability in the United States with a correlation coefficient (R) of 0.566 and weighted average of 11.3%, a difference of 2.0%.
Immigrants from Ireland vs Immigrants from Nigeria Disability

Disability Correlation Summary

MeasurementImmigrants from IrelandImmigrants from Nigeria
Minimum3.4%0.93%
Maximum31.4%31.8%
Range28.0%30.9%
Mean11.7%11.7%
Median11.0%11.2%
Interquartile 25% (IQ1)9.5%9.6%
Interquartile 75% (IQ3)13.1%12.0%
Interquartile Range (IQR)3.6%2.4%
Standard Deviation (Sample)4.7%5.2%
Standard Deviation (Population)4.6%5.1%

Similar Demographics by Disability

Demographics Similar to Immigrants from Ireland by Disability

In terms of disability, the demographic groups most similar to Immigrants from Ireland are Immigrants from Jordan (11.1%, a difference of 0.050%), Immigrants from Cameroon (11.1%, a difference of 0.080%), Sierra Leonean (11.0%, a difference of 0.12%), Immigrants from Belgium (11.0%, a difference of 0.12%), and Immigrants from Vietnam (11.0%, a difference of 0.15%).
DemographicsRating | RankDisability
Immigrants | Bangladesh
99.4
/100
|
#73
Exceptional
11.0%
Immigrants | Serbia
99.4
/100
|
#74
Exceptional
11.0%
Immigrants | Vietnam
99.4
/100
|
#75
Exceptional
11.0%
Sierra Leoneans
99.3
/100
|
#76
Exceptional
11.0%
Immigrants | Belgium
99.3
/100
|
#77
Exceptional
11.0%
Immigrants | Cameroon
99.3
/100
|
#78
Exceptional
11.1%
Immigrants | Jordan
99.3
/100
|
#79
Exceptional
11.1%
Immigrants | Ireland
99.3
/100
|
#80
Exceptional
11.1%
Immigrants | Poland
99.1
/100
|
#81
Exceptional
11.1%
Chileans
99.1
/100
|
#82
Exceptional
11.1%
Immigrants | Switzerland
99.0
/100
|
#83
Exceptional
11.1%
Immigrants | Sierra Leone
99.0
/100
|
#84
Exceptional
11.1%
Immigrants | Belarus
98.9
/100
|
#85
Exceptional
11.1%
Immigrants | Russia
98.9
/100
|
#86
Exceptional
11.1%
Palestinians
98.9
/100
|
#87
Exceptional
11.1%

Demographics Similar to Immigrants from Nigeria by Disability

In terms of disability, the demographic groups most similar to Immigrants from Nigeria are Nicaraguan (11.3%, a difference of 0.080%), Immigrants from Uganda (11.3%, a difference of 0.080%), Immigrants from Eastern Europe (11.3%, a difference of 0.10%), Immigrants from Denmark (11.3%, a difference of 0.10%), and Immigrants from Kazakhstan (11.3%, a difference of 0.13%).
DemographicsRating | RankDisability
Immigrants | Nicaragua
96.8
/100
|
#101
Exceptional
11.3%
Immigrants | Eastern Africa
96.7
/100
|
#102
Exceptional
11.3%
Immigrants | Uruguay
96.4
/100
|
#103
Exceptional
11.3%
Immigrants | Immigrants
96.4
/100
|
#104
Exceptional
11.3%
Immigrants | Kazakhstan
96.4
/100
|
#105
Exceptional
11.3%
Immigrants | Eastern Europe
96.3
/100
|
#106
Exceptional
11.3%
Nicaraguans
96.2
/100
|
#107
Exceptional
11.3%
Immigrants | Nigeria
96.0
/100
|
#108
Exceptional
11.3%
Immigrants | Uganda
95.7
/100
|
#109
Exceptional
11.3%
Immigrants | Denmark
95.6
/100
|
#110
Exceptional
11.3%
Immigrants | South Eastern Asia
95.4
/100
|
#111
Exceptional
11.3%
Immigrants | Uzbekistan
94.9
/100
|
#112
Exceptional
11.3%
Guyanese
94.7
/100
|
#113
Exceptional
11.3%
Immigrants | Syria
94.7
/100
|
#114
Exceptional
11.3%
Immigrants | Philippines
94.6
/100
|
#115
Exceptional
11.3%