Immigrants from Ireland vs Panamanian Nursery School
COMPARE
Immigrants from Ireland
Panamanian
Nursery School
Nursery School Comparison
Immigrants from Ireland
Panamanians
98.3%
NURSERY SCHOOL
97.7/ 100
METRIC RATING
102nd/ 347
METRIC RANK
97.9%
NURSERY SCHOOL
34.3/ 100
METRIC RATING
190th/ 347
METRIC RANK
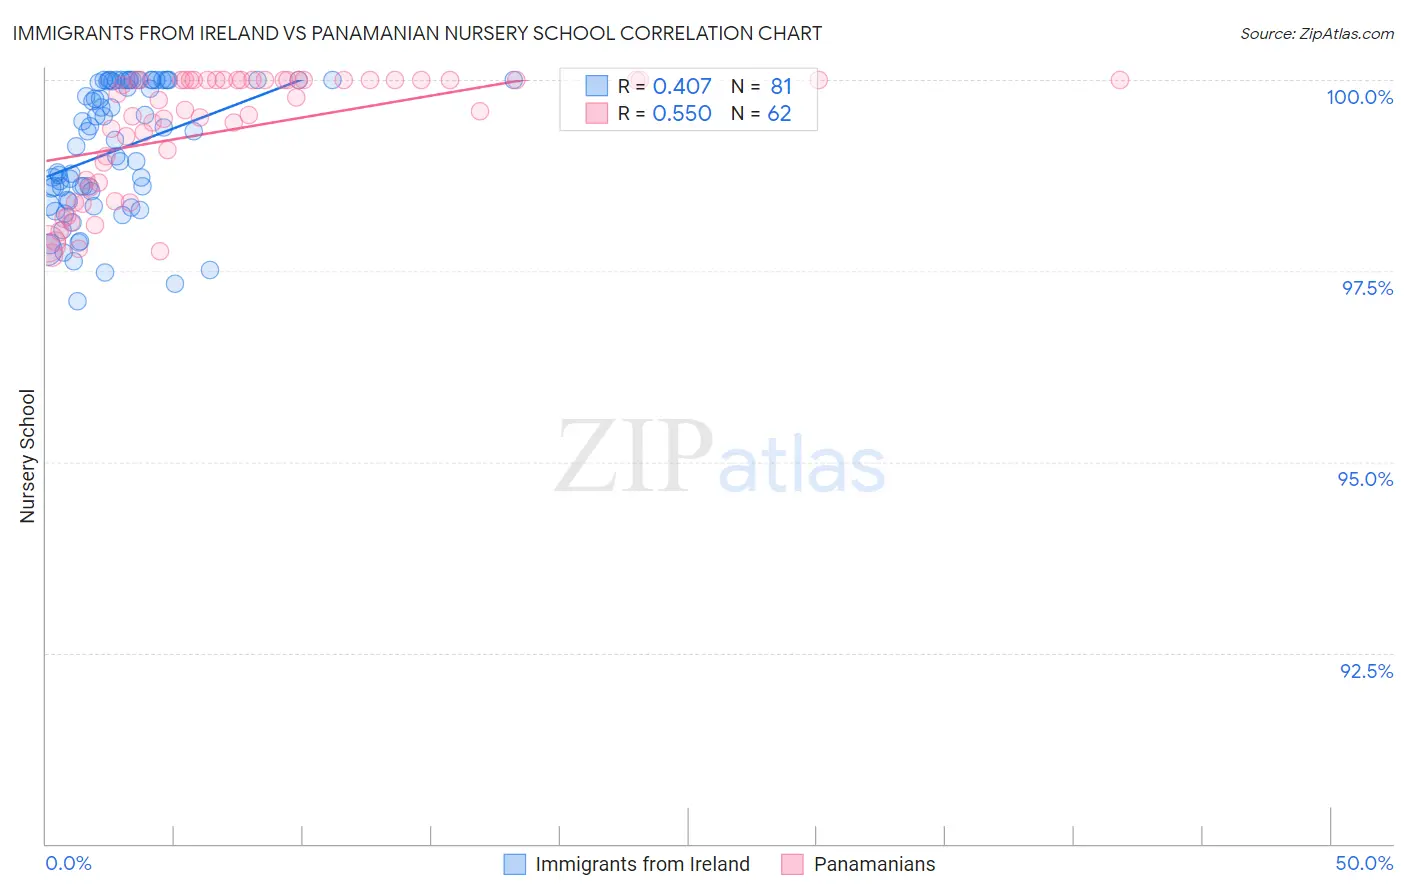
Immigrants from Ireland vs Panamanian Nursery School Correlation Chart
The statistical analysis conducted on geographies consisting of 240,784,498 people shows a moderate positive correlation between the proportion of Immigrants from Ireland and percentage of population with at least nursery school education in the United States with a correlation coefficient (R) of 0.407 and weighted average of 98.3%. Similarly, the statistical analysis conducted on geographies consisting of 281,248,945 people shows a substantial positive correlation between the proportion of Panamanians and percentage of population with at least nursery school education in the United States with a correlation coefficient (R) of 0.550 and weighted average of 97.9%, a difference of 0.33%.
Nursery School Correlation Summary
| Measurement | Immigrants from Ireland | Panamanian |
| Minimum | 97.1% | 97.7% |
| Maximum | 100.0% | 100.0% |
| Range | 2.9% | 2.3% |
| Mean | 99.1% | 99.3% |
| Median | 99.2% | 99.7% |
| Interquartile 25% (IQ1) | 98.4% | 98.7% |
| Interquartile 75% (IQ3) | 100.0% | 100.0% |
| Interquartile Range (IQR) | 1.6% | 1.3% |
| Standard Deviation (Sample) | 0.84% | 0.79% |
| Standard Deviation (Population) | 0.84% | 0.78% |
Similar Demographics by Nursery School
Demographics Similar to Immigrants from Ireland by Nursery School
In terms of nursery school, the demographic groups most similar to Immigrants from Ireland are Cree (98.3%, a difference of 0.0%), Puget Sound Salish (98.3%, a difference of 0.010%), Romanian (98.3%, a difference of 0.010%), Bhutanese (98.2%, a difference of 0.010%), and Turkish (98.2%, a difference of 0.010%).
| Demographics | Rating | Rank | Nursery School |
| South Africans | 98.6 /100 | #95 | Exceptional 98.3% |
| Cypriots | 98.3 /100 | #96 | Exceptional 98.3% |
| Immigrants | Nonimmigrants | 98.3 /100 | #97 | Exceptional 98.3% |
| Choctaw | 98.3 /100 | #98 | Exceptional 98.3% |
| Colville | 98.2 /100 | #99 | Exceptional 98.3% |
| Puget Sound Salish | 98.0 /100 | #100 | Exceptional 98.3% |
| Romanians | 97.9 /100 | #101 | Exceptional 98.3% |
| Immigrants | Ireland | 97.7 /100 | #102 | Exceptional 98.3% |
| Cree | 97.7 /100 | #103 | Exceptional 98.3% |
| Bhutanese | 97.4 /100 | #104 | Exceptional 98.2% |
| Turks | 97.4 /100 | #105 | Exceptional 98.2% |
| Immigrants | Switzerland | 97.3 /100 | #106 | Exceptional 98.2% |
| Basques | 97.3 /100 | #107 | Exceptional 98.2% |
| Pima | 97.1 /100 | #108 | Exceptional 98.2% |
| German Russians | 97.1 /100 | #109 | Exceptional 98.2% |
Demographics Similar to Panamanians by Nursery School
In terms of nursery school, the demographic groups most similar to Panamanians are Arab (97.9%, a difference of 0.0%), Pakistani (97.9%, a difference of 0.0%), Immigrants from Kazakhstan (97.9%, a difference of 0.010%), Immigrants from Taiwan (97.9%, a difference of 0.010%), and Portuguese (98.0%, a difference of 0.020%).
| Demographics | Rating | Rank | Nursery School |
| Portuguese | 41.8 /100 | #183 | Average 98.0% |
| Immigrants | Poland | 41.3 /100 | #184 | Average 98.0% |
| Immigrants | Belarus | 41.0 /100 | #185 | Average 98.0% |
| Immigrants | Argentina | 40.8 /100 | #186 | Average 98.0% |
| Immigrants | Kazakhstan | 37.1 /100 | #187 | Fair 97.9% |
| Arabs | 34.7 /100 | #188 | Fair 97.9% |
| Pakistanis | 34.6 /100 | #189 | Fair 97.9% |
| Panamanians | 34.3 /100 | #190 | Fair 97.9% |
| Immigrants | Taiwan | 30.6 /100 | #191 | Fair 97.9% |
| Blacks/African Americans | 29.4 /100 | #192 | Fair 97.9% |
| Paraguayans | 27.4 /100 | #193 | Fair 97.9% |
| Mongolians | 27.3 /100 | #194 | Fair 97.9% |
| Hawaiians | 27.2 /100 | #195 | Fair 97.9% |
| Guamanians/Chamorros | 25.7 /100 | #196 | Fair 97.9% |
| Yuman | 25.7 /100 | #197 | Fair 97.9% |