Immigrants from Ireland vs Cree Disability
COMPARE
Immigrants from Ireland
Cree
Disability
Disability Comparison
Immigrants from Ireland
Cree
11.1%
DISABILITY
99.3/ 100
METRIC RATING
80th/ 347
METRIC RANK
13.7%
DISABILITY
0.0/ 100
METRIC RATING
313th/ 347
METRIC RANK
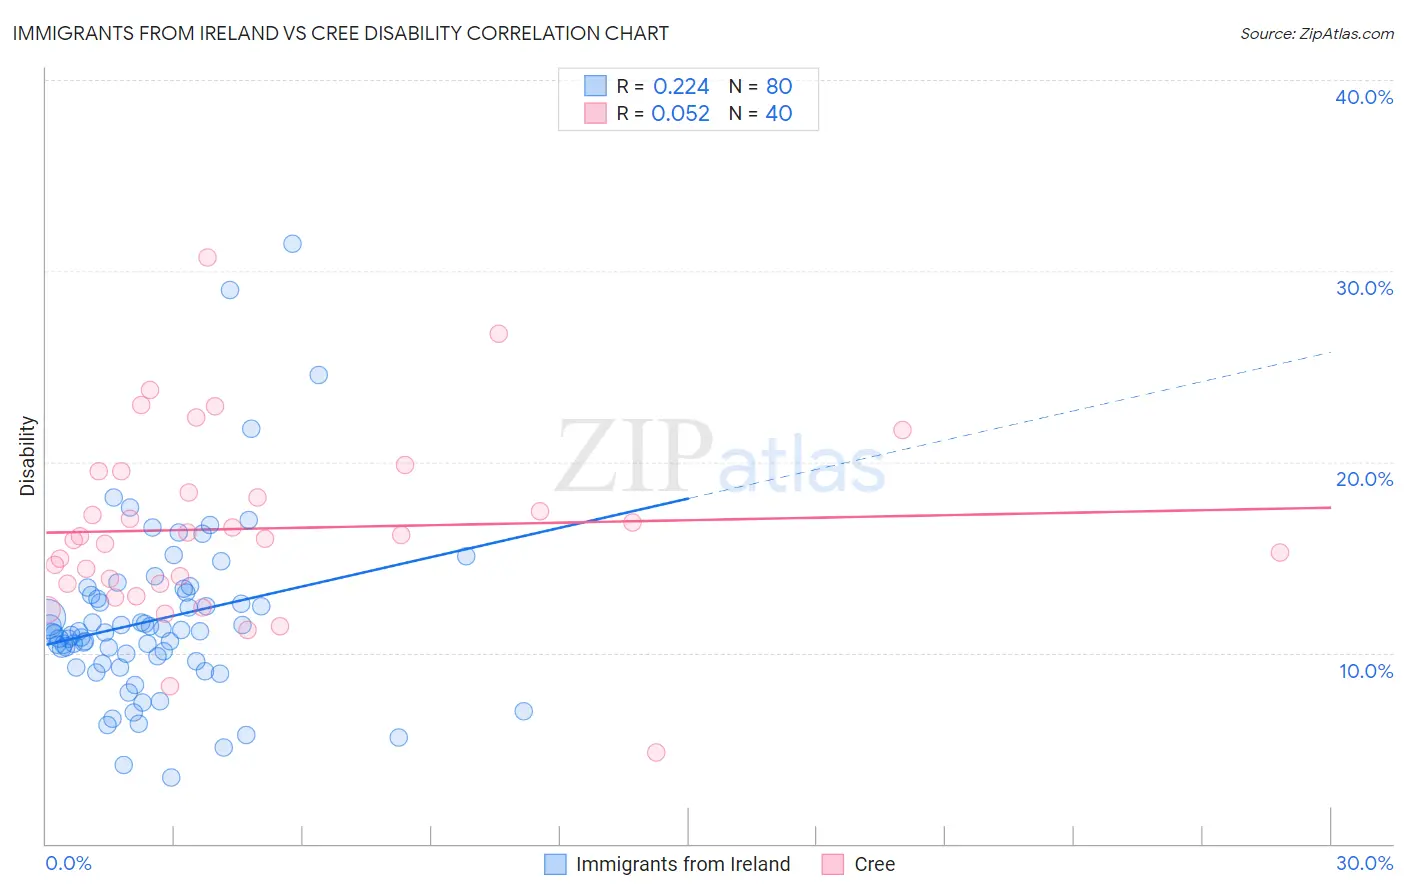
Immigrants from Ireland vs Cree Disability Correlation Chart
The statistical analysis conducted on geographies consisting of 240,775,613 people shows a weak positive correlation between the proportion of Immigrants from Ireland and percentage of population with a disability in the United States with a correlation coefficient (R) of 0.224 and weighted average of 11.1%. Similarly, the statistical analysis conducted on geographies consisting of 76,208,800 people shows a slight positive correlation between the proportion of Cree and percentage of population with a disability in the United States with a correlation coefficient (R) of 0.052 and weighted average of 13.7%, a difference of 23.8%.
Disability Correlation Summary
| Measurement | Immigrants from Ireland | Cree |
| Minimum | 3.4% | 4.8% |
| Maximum | 31.4% | 30.7% |
| Range | 28.0% | 25.9% |
| Mean | 11.7% | 16.5% |
| Median | 11.0% | 16.1% |
| Interquartile 25% (IQ1) | 9.5% | 13.6% |
| Interquartile 75% (IQ3) | 13.1% | 18.9% |
| Interquartile Range (IQR) | 3.6% | 5.3% |
| Standard Deviation (Sample) | 4.7% | 4.9% |
| Standard Deviation (Population) | 4.6% | 4.8% |
Similar Demographics by Disability
Demographics Similar to Immigrants from Ireland by Disability
In terms of disability, the demographic groups most similar to Immigrants from Ireland are Immigrants from Jordan (11.1%, a difference of 0.050%), Immigrants from Cameroon (11.1%, a difference of 0.080%), Sierra Leonean (11.0%, a difference of 0.12%), Immigrants from Belgium (11.0%, a difference of 0.12%), and Immigrants from Vietnam (11.0%, a difference of 0.15%).
| Demographics | Rating | Rank | Disability |
| Immigrants | Bangladesh | 99.4 /100 | #73 | Exceptional 11.0% |
| Immigrants | Serbia | 99.4 /100 | #74 | Exceptional 11.0% |
| Immigrants | Vietnam | 99.4 /100 | #75 | Exceptional 11.0% |
| Sierra Leoneans | 99.3 /100 | #76 | Exceptional 11.0% |
| Immigrants | Belgium | 99.3 /100 | #77 | Exceptional 11.0% |
| Immigrants | Cameroon | 99.3 /100 | #78 | Exceptional 11.1% |
| Immigrants | Jordan | 99.3 /100 | #79 | Exceptional 11.1% |
| Immigrants | Ireland | 99.3 /100 | #80 | Exceptional 11.1% |
| Immigrants | Poland | 99.1 /100 | #81 | Exceptional 11.1% |
| Chileans | 99.1 /100 | #82 | Exceptional 11.1% |
| Immigrants | Switzerland | 99.0 /100 | #83 | Exceptional 11.1% |
| Immigrants | Sierra Leone | 99.0 /100 | #84 | Exceptional 11.1% |
| Immigrants | Belarus | 98.9 /100 | #85 | Exceptional 11.1% |
| Immigrants | Russia | 98.9 /100 | #86 | Exceptional 11.1% |
| Palestinians | 98.9 /100 | #87 | Exceptional 11.1% |
Demographics Similar to Cree by Disability
In terms of disability, the demographic groups most similar to Cree are Black/African American (13.7%, a difference of 0.040%), Puget Sound Salish (13.7%, a difference of 0.040%), Pima (13.7%, a difference of 0.070%), Immigrants from Cabo Verde (13.7%, a difference of 0.070%), and Spanish American (13.6%, a difference of 0.35%).
| Demographics | Rating | Rank | Disability |
| Cape Verdeans | 0.0 /100 | #306 | Tragic 13.5% |
| Shoshone | 0.0 /100 | #307 | Tragic 13.5% |
| French American Indians | 0.0 /100 | #308 | Tragic 13.5% |
| Tlingit-Haida | 0.0 /100 | #309 | Tragic 13.5% |
| Blackfeet | 0.0 /100 | #310 | Tragic 13.6% |
| Delaware | 0.0 /100 | #311 | Tragic 13.6% |
| Spanish Americans | 0.0 /100 | #312 | Tragic 13.6% |
| Cree | 0.0 /100 | #313 | Tragic 13.7% |
| Blacks/African Americans | 0.0 /100 | #314 | Tragic 13.7% |
| Puget Sound Salish | 0.0 /100 | #315 | Tragic 13.7% |
| Pima | 0.0 /100 | #316 | Tragic 13.7% |
| Immigrants | Cabo Verde | 0.0 /100 | #317 | Tragic 13.7% |
| Menominee | 0.0 /100 | #318 | Tragic 13.8% |
| Iroquois | 0.0 /100 | #319 | Tragic 13.8% |
| Apache | 0.0 /100 | #320 | Tragic 13.9% |