Immigrants from Ireland vs Lebanese Disability
COMPARE
Immigrants from Ireland
Lebanese
Disability
Disability Comparison
Immigrants from Ireland
Lebanese
11.1%
DISABILITY
99.3/ 100
METRIC RATING
80th/ 347
METRIC RANK
11.8%
DISABILITY
27.9/ 100
METRIC RATING
187th/ 347
METRIC RANK
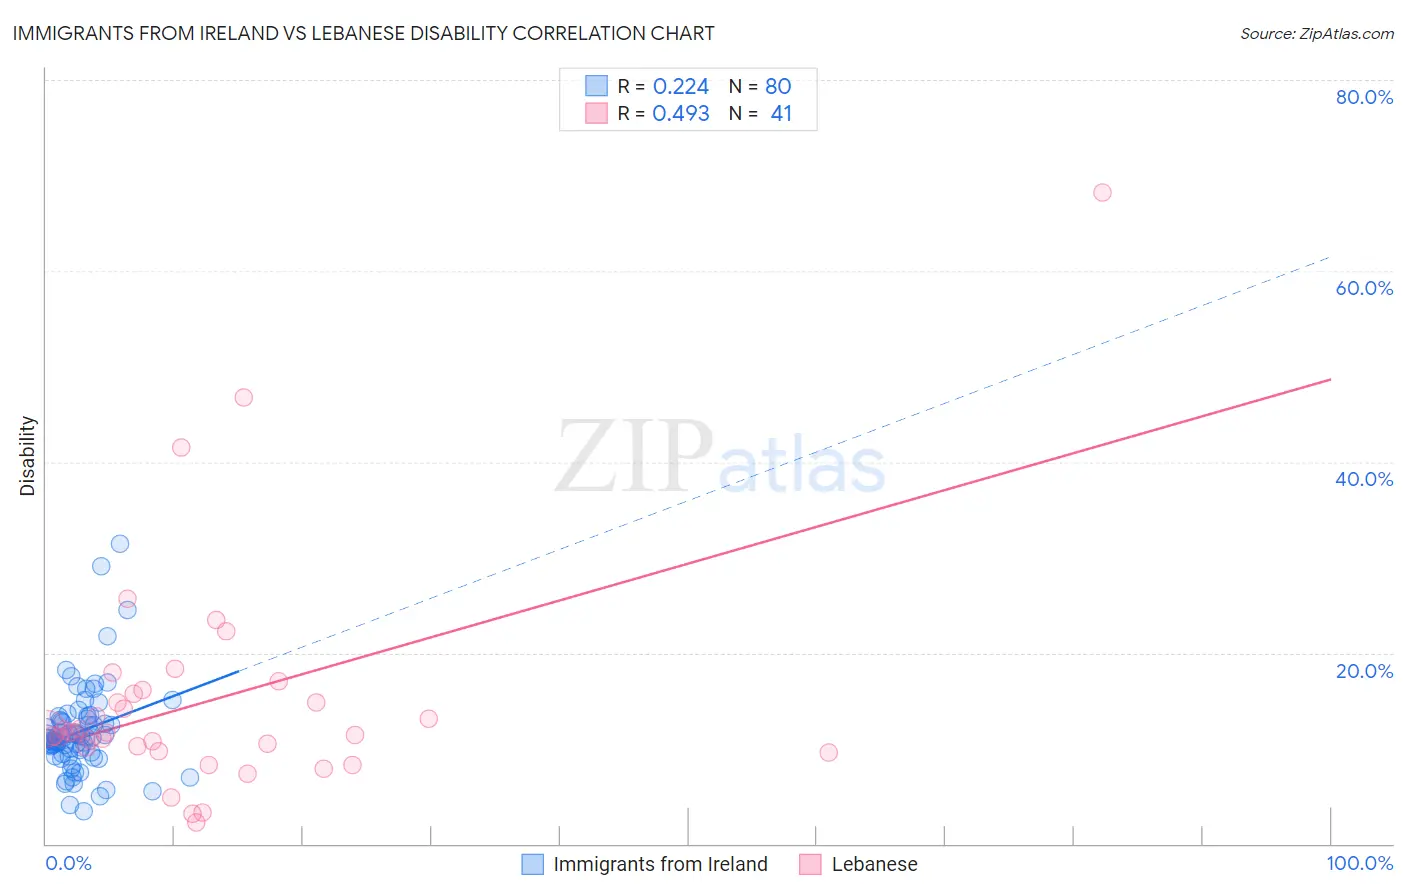
Immigrants from Ireland vs Lebanese Disability Correlation Chart
The statistical analysis conducted on geographies consisting of 240,775,613 people shows a weak positive correlation between the proportion of Immigrants from Ireland and percentage of population with a disability in the United States with a correlation coefficient (R) of 0.224 and weighted average of 11.1%. Similarly, the statistical analysis conducted on geographies consisting of 401,592,225 people shows a moderate positive correlation between the proportion of Lebanese and percentage of population with a disability in the United States with a correlation coefficient (R) of 0.493 and weighted average of 11.8%, a difference of 6.9%.
Disability Correlation Summary
| Measurement | Immigrants from Ireland | Lebanese |
| Minimum | 3.4% | 2.2% |
| Maximum | 31.4% | 68.2% |
| Range | 28.0% | 66.0% |
| Mean | 11.7% | 15.0% |
| Median | 11.0% | 11.6% |
| Interquartile 25% (IQ1) | 9.5% | 9.9% |
| Interquartile 75% (IQ3) | 13.1% | 16.0% |
| Interquartile Range (IQR) | 3.6% | 6.0% |
| Standard Deviation (Sample) | 4.7% | 12.1% |
| Standard Deviation (Population) | 4.6% | 11.9% |
Similar Demographics by Disability
Demographics Similar to Immigrants from Ireland by Disability
In terms of disability, the demographic groups most similar to Immigrants from Ireland are Immigrants from Jordan (11.1%, a difference of 0.050%), Immigrants from Cameroon (11.1%, a difference of 0.080%), Sierra Leonean (11.0%, a difference of 0.12%), Immigrants from Belgium (11.0%, a difference of 0.12%), and Immigrants from Vietnam (11.0%, a difference of 0.15%).
| Demographics | Rating | Rank | Disability |
| Immigrants | Bangladesh | 99.4 /100 | #73 | Exceptional 11.0% |
| Immigrants | Serbia | 99.4 /100 | #74 | Exceptional 11.0% |
| Immigrants | Vietnam | 99.4 /100 | #75 | Exceptional 11.0% |
| Sierra Leoneans | 99.3 /100 | #76 | Exceptional 11.0% |
| Immigrants | Belgium | 99.3 /100 | #77 | Exceptional 11.0% |
| Immigrants | Cameroon | 99.3 /100 | #78 | Exceptional 11.1% |
| Immigrants | Jordan | 99.3 /100 | #79 | Exceptional 11.1% |
| Immigrants | Ireland | 99.3 /100 | #80 | Exceptional 11.1% |
| Immigrants | Poland | 99.1 /100 | #81 | Exceptional 11.1% |
| Chileans | 99.1 /100 | #82 | Exceptional 11.1% |
| Immigrants | Switzerland | 99.0 /100 | #83 | Exceptional 11.1% |
| Immigrants | Sierra Leone | 99.0 /100 | #84 | Exceptional 11.1% |
| Immigrants | Belarus | 98.9 /100 | #85 | Exceptional 11.1% |
| Immigrants | Russia | 98.9 /100 | #86 | Exceptional 11.1% |
| Palestinians | 98.9 /100 | #87 | Exceptional 11.1% |
Demographics Similar to Lebanese by Disability
In terms of disability, the demographic groups most similar to Lebanese are Immigrants from Scotland (11.8%, a difference of 0.020%), Immigrants from Burma/Myanmar (11.8%, a difference of 0.030%), Iraqi (11.8%, a difference of 0.11%), Honduran (11.8%, a difference of 0.18%), and Immigrants from Mexico (11.9%, a difference of 0.24%).
| Demographics | Rating | Rank | Disability |
| Immigrants | Honduras | 37.8 /100 | #180 | Fair 11.8% |
| Immigrants | Oceania | 34.3 /100 | #181 | Fair 11.8% |
| Icelanders | 34.0 /100 | #182 | Fair 11.8% |
| Hondurans | 31.2 /100 | #183 | Fair 11.8% |
| Iraqis | 30.0 /100 | #184 | Fair 11.8% |
| Immigrants | Burma/Myanmar | 28.5 /100 | #185 | Fair 11.8% |
| Immigrants | Scotland | 28.2 /100 | #186 | Fair 11.8% |
| Lebanese | 27.9 /100 | #187 | Fair 11.8% |
| Immigrants | Mexico | 23.8 /100 | #188 | Fair 11.9% |
| Immigrants | Zaire | 21.8 /100 | #189 | Fair 11.9% |
| Immigrants | West Indies | 21.1 /100 | #190 | Fair 11.9% |
| Ute | 19.5 /100 | #191 | Poor 11.9% |
| Lithuanians | 18.8 /100 | #192 | Poor 11.9% |
| Immigrants | Bosnia and Herzegovina | 18.0 /100 | #193 | Poor 11.9% |
| Somalis | 17.3 /100 | #194 | Poor 11.9% |