Immigrants from Ireland vs Immigrants from Ethiopia Vision Disability
COMPARE
Immigrants from Ireland
Immigrants from Ethiopia
Vision Disability
Vision Disability Comparison
Immigrants from Ireland
Immigrants from Ethiopia
2.0%
VISION DISABILITY
99.7/ 100
METRIC RATING
40th/ 347
METRIC RANK
2.0%
VISION DISABILITY
99.7/ 100
METRIC RATING
42nd/ 347
METRIC RANK
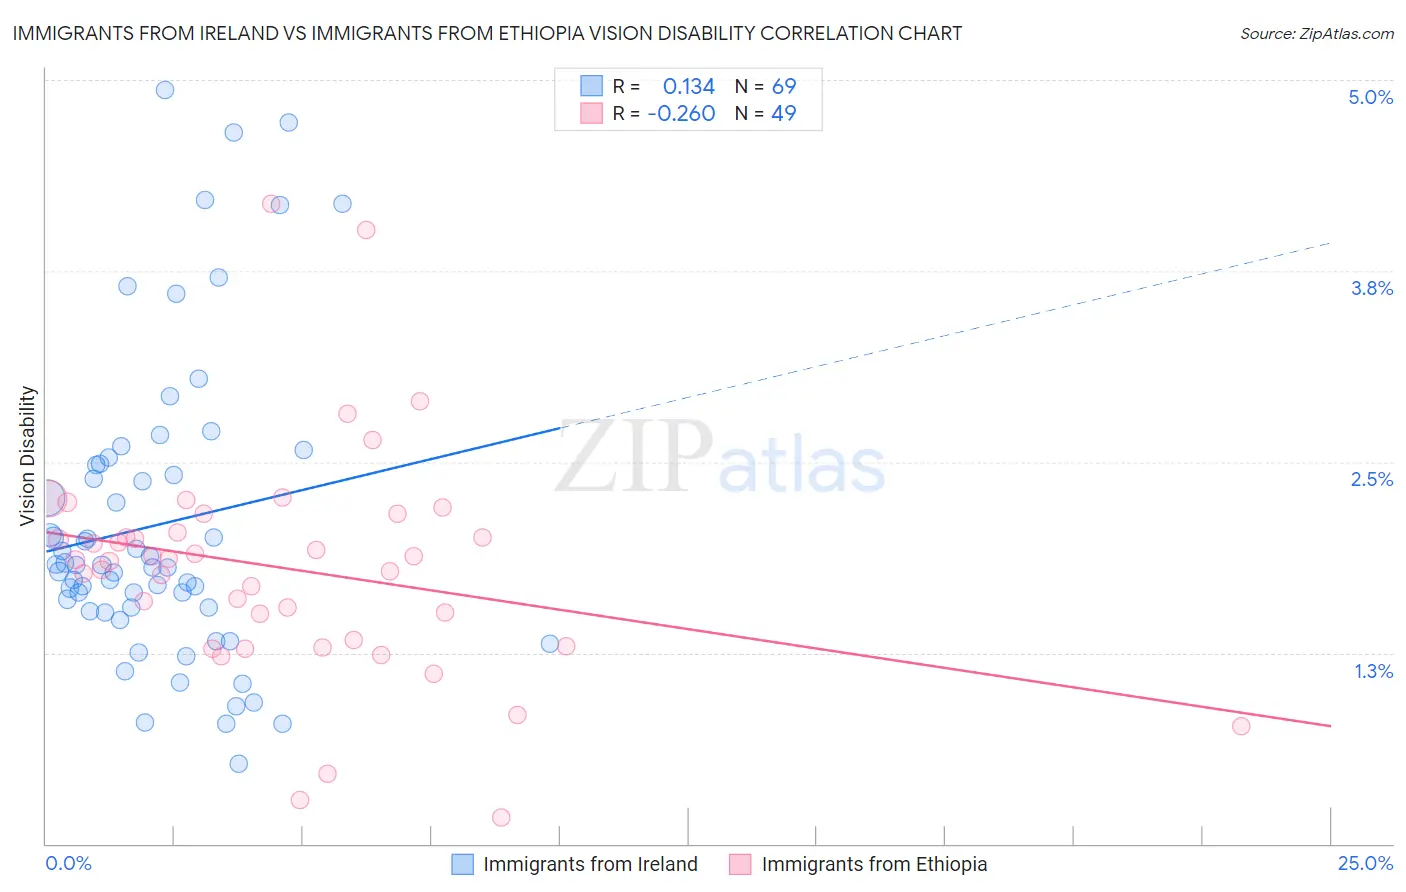
Immigrants from Ireland vs Immigrants from Ethiopia Vision Disability Correlation Chart
The statistical analysis conducted on geographies consisting of 240,640,938 people shows a poor positive correlation between the proportion of Immigrants from Ireland and percentage of population with vision disability in the United States with a correlation coefficient (R) of 0.134 and weighted average of 2.0%. Similarly, the statistical analysis conducted on geographies consisting of 211,444,224 people shows a weak negative correlation between the proportion of Immigrants from Ethiopia and percentage of population with vision disability in the United States with a correlation coefficient (R) of -0.260 and weighted average of 2.0%, a difference of 0.18%.
Vision Disability Correlation Summary
| Measurement | Immigrants from Ireland | Immigrants from Ethiopia |
| Minimum | 0.52% | 0.17% |
| Maximum | 4.9% | 4.2% |
| Range | 4.4% | 4.0% |
| Mean | 2.1% | 1.8% |
| Median | 1.8% | 1.9% |
| Interquartile 25% (IQ1) | 1.5% | 1.3% |
| Interquartile 75% (IQ3) | 2.5% | 2.1% |
| Interquartile Range (IQR) | 0.95% | 0.79% |
| Standard Deviation (Sample) | 0.99% | 0.74% |
| Standard Deviation (Population) | 0.98% | 0.74% |
Demographics Similar to Immigrants from Ireland and Immigrants from Ethiopia by Vision Disability
In terms of vision disability, the demographic groups most similar to Immigrants from Ireland are Cypriot (2.0%, a difference of 0.030%), Zimbabwean (2.0%, a difference of 0.20%), Eastern European (2.0%, a difference of 0.24%), Immigrants from Kuwait (2.0%, a difference of 0.26%), and Immigrants from Indonesia (2.0%, a difference of 0.27%). Similarly, the demographic groups most similar to Immigrants from Ethiopia are Eastern European (2.0%, a difference of 0.060%), Immigrants from Indonesia (2.0%, a difference of 0.090%), Ethiopian (2.0%, a difference of 0.11%), Immigrants from Sweden (2.0%, a difference of 0.15%), and Cypriot (2.0%, a difference of 0.16%).
| Demographics | Rating | Rank | Vision Disability |
| Mongolians | 99.9 /100 | #31 | Exceptional 1.9% |
| Luxembourgers | 99.9 /100 | #32 | Exceptional 1.9% |
| Immigrants | Egypt | 99.9 /100 | #33 | Exceptional 1.9% |
| Immigrants | Turkey | 99.8 /100 | #34 | Exceptional 1.9% |
| Immigrants | Australia | 99.8 /100 | #35 | Exceptional 1.9% |
| Cambodians | 99.8 /100 | #36 | Exceptional 2.0% |
| Bhutanese | 99.8 /100 | #37 | Exceptional 2.0% |
| Immigrants | Kuwait | 99.8 /100 | #38 | Exceptional 2.0% |
| Zimbabweans | 99.7 /100 | #39 | Exceptional 2.0% |
| Immigrants | Ireland | 99.7 /100 | #40 | Exceptional 2.0% |
| Cypriots | 99.7 /100 | #41 | Exceptional 2.0% |
| Immigrants | Ethiopia | 99.7 /100 | #42 | Exceptional 2.0% |
| Eastern Europeans | 99.7 /100 | #43 | Exceptional 2.0% |
| Immigrants | Indonesia | 99.7 /100 | #44 | Exceptional 2.0% |
| Ethiopians | 99.7 /100 | #45 | Exceptional 2.0% |
| Immigrants | Sweden | 99.7 /100 | #46 | Exceptional 2.0% |
| Immigrants | Bulgaria | 99.7 /100 | #47 | Exceptional 2.0% |
| Israelis | 99.6 /100 | #48 | Exceptional 2.0% |
| Latvians | 99.5 /100 | #49 | Exceptional 2.0% |
| Afghans | 99.5 /100 | #50 | Exceptional 2.0% |
| Tongans | 99.5 /100 | #51 | Exceptional 2.0% |