Immigrants from Ireland vs Asian Vision Disability
COMPARE
Immigrants from Ireland
Asian
Vision Disability
Vision Disability Comparison
Immigrants from Ireland
Asians
2.0%
VISION DISABILITY
99.7/ 100
METRIC RATING
40th/ 347
METRIC RANK
1.9%
VISION DISABILITY
100.0/ 100
METRIC RATING
20th/ 347
METRIC RANK
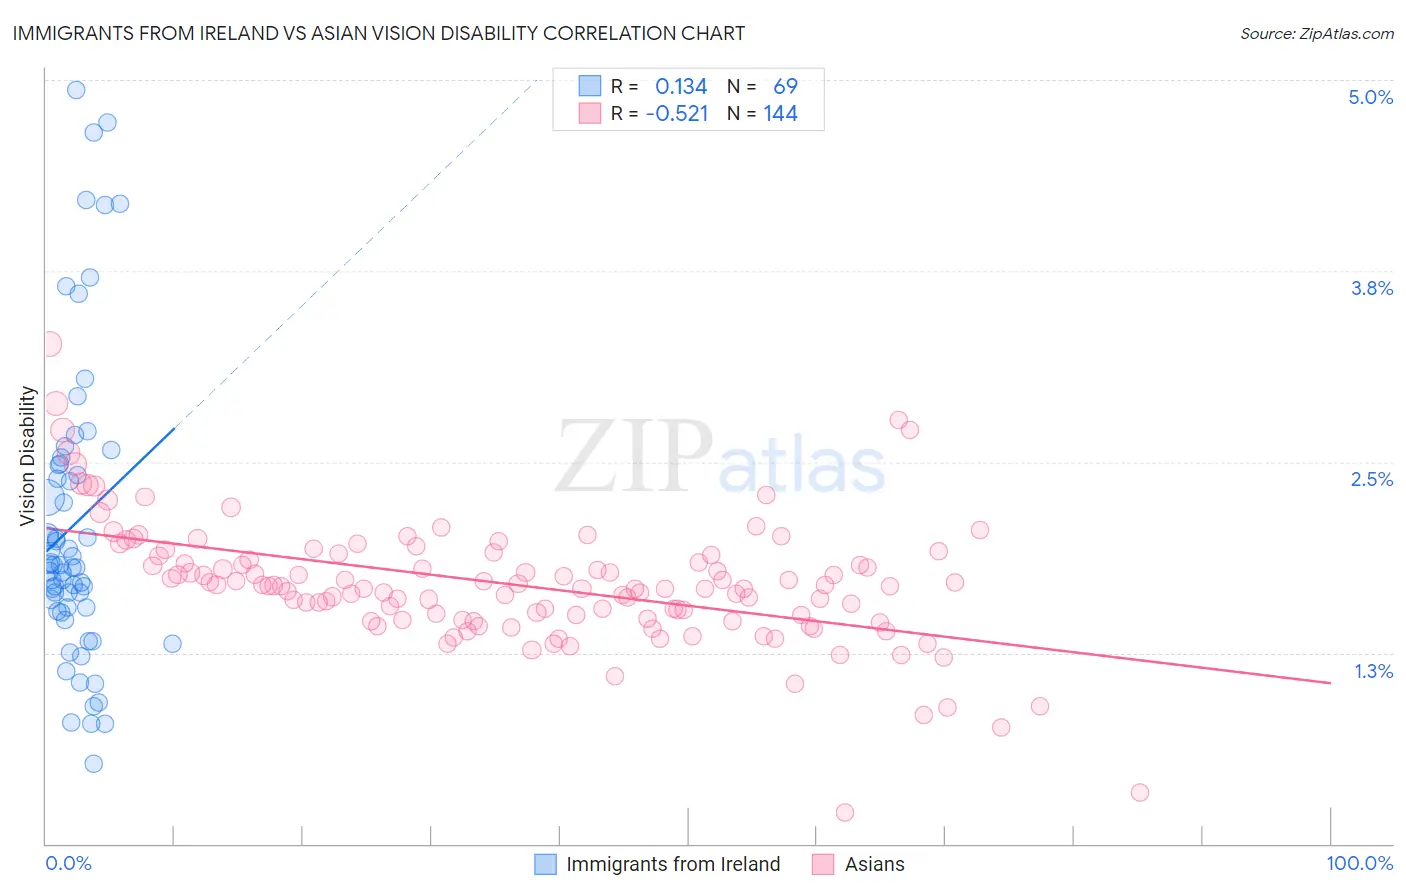
Immigrants from Ireland vs Asian Vision Disability Correlation Chart
The statistical analysis conducted on geographies consisting of 240,640,938 people shows a poor positive correlation between the proportion of Immigrants from Ireland and percentage of population with vision disability in the United States with a correlation coefficient (R) of 0.134 and weighted average of 2.0%. Similarly, the statistical analysis conducted on geographies consisting of 549,556,904 people shows a substantial negative correlation between the proportion of Asians and percentage of population with vision disability in the United States with a correlation coefficient (R) of -0.521 and weighted average of 1.9%, a difference of 3.5%.
Vision Disability Correlation Summary
| Measurement | Immigrants from Ireland | Asian |
| Minimum | 0.52% | 0.21% |
| Maximum | 4.9% | 3.3% |
| Range | 4.4% | 3.1% |
| Mean | 2.1% | 1.7% |
| Median | 1.8% | 1.7% |
| Interquartile 25% (IQ1) | 1.5% | 1.5% |
| Interquartile 75% (IQ3) | 2.5% | 1.9% |
| Interquartile Range (IQR) | 0.95% | 0.42% |
| Standard Deviation (Sample) | 0.99% | 0.41% |
| Standard Deviation (Population) | 0.98% | 0.41% |
Demographics Similar to Immigrants from Ireland and Asians by Vision Disability
In terms of vision disability, the demographic groups most similar to Immigrants from Ireland are Zimbabwean (2.0%, a difference of 0.20%), Immigrants from Kuwait (2.0%, a difference of 0.26%), Bhutanese (2.0%, a difference of 0.29%), Cambodian (2.0%, a difference of 0.54%), and Immigrants from Australia (1.9%, a difference of 0.89%). Similarly, the demographic groups most similar to Asians are Turkish (1.9%, a difference of 0.31%), Immigrants from Pakistan (1.9%, a difference of 0.35%), Immigrants from Asia (1.9%, a difference of 0.89%), Immigrants from Lithuania (1.9%, a difference of 1.0%), and Bulgarian (1.9%, a difference of 1.1%).
| Demographics | Rating | Rank | Vision Disability |
| Asians | 100.0 /100 | #20 | Exceptional 1.9% |
| Turks | 100.0 /100 | #21 | Exceptional 1.9% |
| Immigrants | Pakistan | 100.0 /100 | #22 | Exceptional 1.9% |
| Immigrants | Asia | 99.9 /100 | #23 | Exceptional 1.9% |
| Immigrants | Lithuania | 99.9 /100 | #24 | Exceptional 1.9% |
| Bulgarians | 99.9 /100 | #25 | Exceptional 1.9% |
| Immigrants | Japan | 99.9 /100 | #26 | Exceptional 1.9% |
| Taiwanese | 99.9 /100 | #27 | Exceptional 1.9% |
| Immigrants | Malaysia | 99.9 /100 | #28 | Exceptional 1.9% |
| Egyptians | 99.9 /100 | #29 | Exceptional 1.9% |
| Immigrants | Nepal | 99.9 /100 | #30 | Exceptional 1.9% |
| Mongolians | 99.9 /100 | #31 | Exceptional 1.9% |
| Luxembourgers | 99.9 /100 | #32 | Exceptional 1.9% |
| Immigrants | Egypt | 99.9 /100 | #33 | Exceptional 1.9% |
| Immigrants | Turkey | 99.8 /100 | #34 | Exceptional 1.9% |
| Immigrants | Australia | 99.8 /100 | #35 | Exceptional 1.9% |
| Cambodians | 99.8 /100 | #36 | Exceptional 2.0% |
| Bhutanese | 99.8 /100 | #37 | Exceptional 2.0% |
| Immigrants | Kuwait | 99.8 /100 | #38 | Exceptional 2.0% |
| Zimbabweans | 99.7 /100 | #39 | Exceptional 2.0% |
| Immigrants | Ireland | 99.7 /100 | #40 | Exceptional 2.0% |