Immigrants from Ireland vs Inupiat Vision Disability
COMPARE
Immigrants from Ireland
Inupiat
Vision Disability
Vision Disability Comparison
Immigrants from Ireland
Inupiat
2.0%
VISION DISABILITY
99.7/ 100
METRIC RATING
40th/ 347
METRIC RANK
2.7%
VISION DISABILITY
0.0/ 100
METRIC RATING
314th/ 347
METRIC RANK
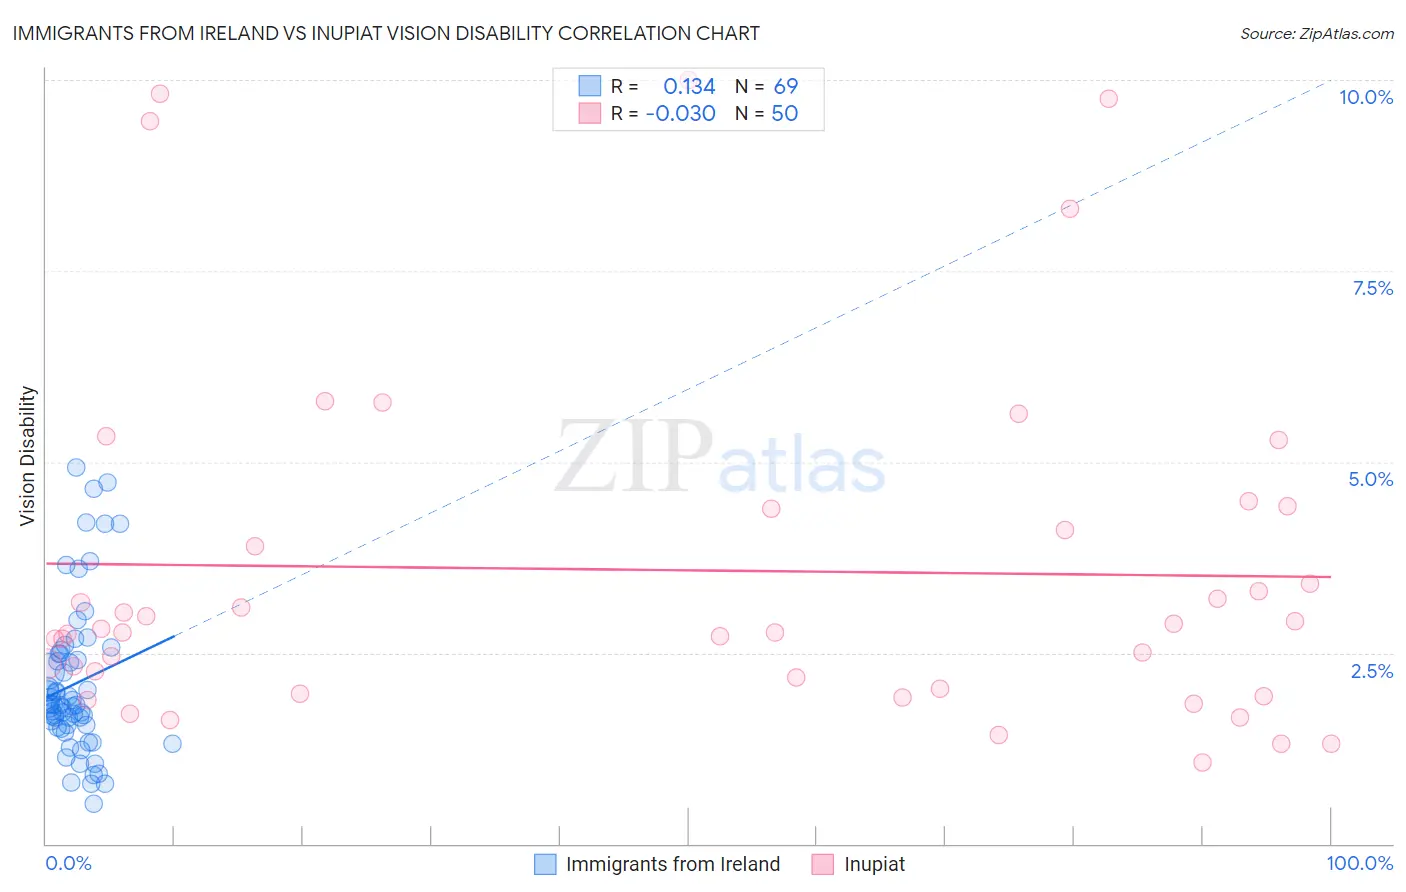
Immigrants from Ireland vs Inupiat Vision Disability Correlation Chart
The statistical analysis conducted on geographies consisting of 240,640,938 people shows a poor positive correlation between the proportion of Immigrants from Ireland and percentage of population with vision disability in the United States with a correlation coefficient (R) of 0.134 and weighted average of 2.0%. Similarly, the statistical analysis conducted on geographies consisting of 96,318,866 people shows no correlation between the proportion of Inupiat and percentage of population with vision disability in the United States with a correlation coefficient (R) of -0.030 and weighted average of 2.7%, a difference of 34.8%.
Vision Disability Correlation Summary
| Measurement | Immigrants from Ireland | Inupiat |
| Minimum | 0.52% | 1.1% |
| Maximum | 4.9% | 10.0% |
| Range | 4.4% | 8.9% |
| Mean | 2.1% | 3.6% |
| Median | 1.8% | 2.8% |
| Interquartile 25% (IQ1) | 1.5% | 2.0% |
| Interquartile 75% (IQ3) | 2.5% | 4.4% |
| Interquartile Range (IQR) | 0.95% | 2.4% |
| Standard Deviation (Sample) | 0.99% | 2.3% |
| Standard Deviation (Population) | 0.98% | 2.3% |
Similar Demographics by Vision Disability
Demographics Similar to Immigrants from Ireland by Vision Disability
In terms of vision disability, the demographic groups most similar to Immigrants from Ireland are Cypriot (2.0%, a difference of 0.030%), Immigrants from Ethiopia (2.0%, a difference of 0.18%), Zimbabwean (2.0%, a difference of 0.20%), Eastern European (2.0%, a difference of 0.24%), and Immigrants from Kuwait (2.0%, a difference of 0.26%).
| Demographics | Rating | Rank | Vision Disability |
| Immigrants | Egypt | 99.9 /100 | #33 | Exceptional 1.9% |
| Immigrants | Turkey | 99.8 /100 | #34 | Exceptional 1.9% |
| Immigrants | Australia | 99.8 /100 | #35 | Exceptional 1.9% |
| Cambodians | 99.8 /100 | #36 | Exceptional 2.0% |
| Bhutanese | 99.8 /100 | #37 | Exceptional 2.0% |
| Immigrants | Kuwait | 99.8 /100 | #38 | Exceptional 2.0% |
| Zimbabweans | 99.7 /100 | #39 | Exceptional 2.0% |
| Immigrants | Ireland | 99.7 /100 | #40 | Exceptional 2.0% |
| Cypriots | 99.7 /100 | #41 | Exceptional 2.0% |
| Immigrants | Ethiopia | 99.7 /100 | #42 | Exceptional 2.0% |
| Eastern Europeans | 99.7 /100 | #43 | Exceptional 2.0% |
| Immigrants | Indonesia | 99.7 /100 | #44 | Exceptional 2.0% |
| Ethiopians | 99.7 /100 | #45 | Exceptional 2.0% |
| Immigrants | Sweden | 99.7 /100 | #46 | Exceptional 2.0% |
| Immigrants | Bulgaria | 99.7 /100 | #47 | Exceptional 2.0% |
Demographics Similar to Inupiat by Vision Disability
In terms of vision disability, the demographic groups most similar to Inupiat are Potawatomi (2.6%, a difference of 0.070%), American (2.6%, a difference of 0.080%), Dominican (2.6%, a difference of 0.91%), Blackfeet (2.6%, a difference of 0.95%), and Osage (2.7%, a difference of 1.2%).
| Demographics | Rating | Rank | Vision Disability |
| Immigrants | Dominican Republic | 0.0 /100 | #307 | Tragic 2.6% |
| Arapaho | 0.0 /100 | #308 | Tragic 2.6% |
| Immigrants | Yemen | 0.0 /100 | #309 | Tragic 2.6% |
| Blackfeet | 0.0 /100 | #310 | Tragic 2.6% |
| Dominicans | 0.0 /100 | #311 | Tragic 2.6% |
| Americans | 0.0 /100 | #312 | Tragic 2.6% |
| Potawatomi | 0.0 /100 | #313 | Tragic 2.6% |
| Inupiat | 0.0 /100 | #314 | Tragic 2.7% |
| Osage | 0.0 /100 | #315 | Tragic 2.7% |
| Shoshone | 0.0 /100 | #316 | Tragic 2.7% |
| Yup'ik | 0.0 /100 | #317 | Tragic 2.7% |
| Alaska Natives | 0.0 /100 | #318 | Tragic 2.7% |
| Tohono O'odham | 0.0 /100 | #319 | Tragic 2.8% |
| Blacks/African Americans | 0.0 /100 | #320 | Tragic 2.8% |
| Comanche | 0.0 /100 | #321 | Tragic 2.8% |