Immigrants from Ireland vs Immigrants from Ecuador Vision Disability
COMPARE
Immigrants from Ireland
Immigrants from Ecuador
Vision Disability
Vision Disability Comparison
Immigrants from Ireland
Immigrants from Ecuador
2.0%
VISION DISABILITY
99.7/ 100
METRIC RATING
40th/ 347
METRIC RANK
2.3%
VISION DISABILITY
2.0/ 100
METRIC RATING
231st/ 347
METRIC RANK
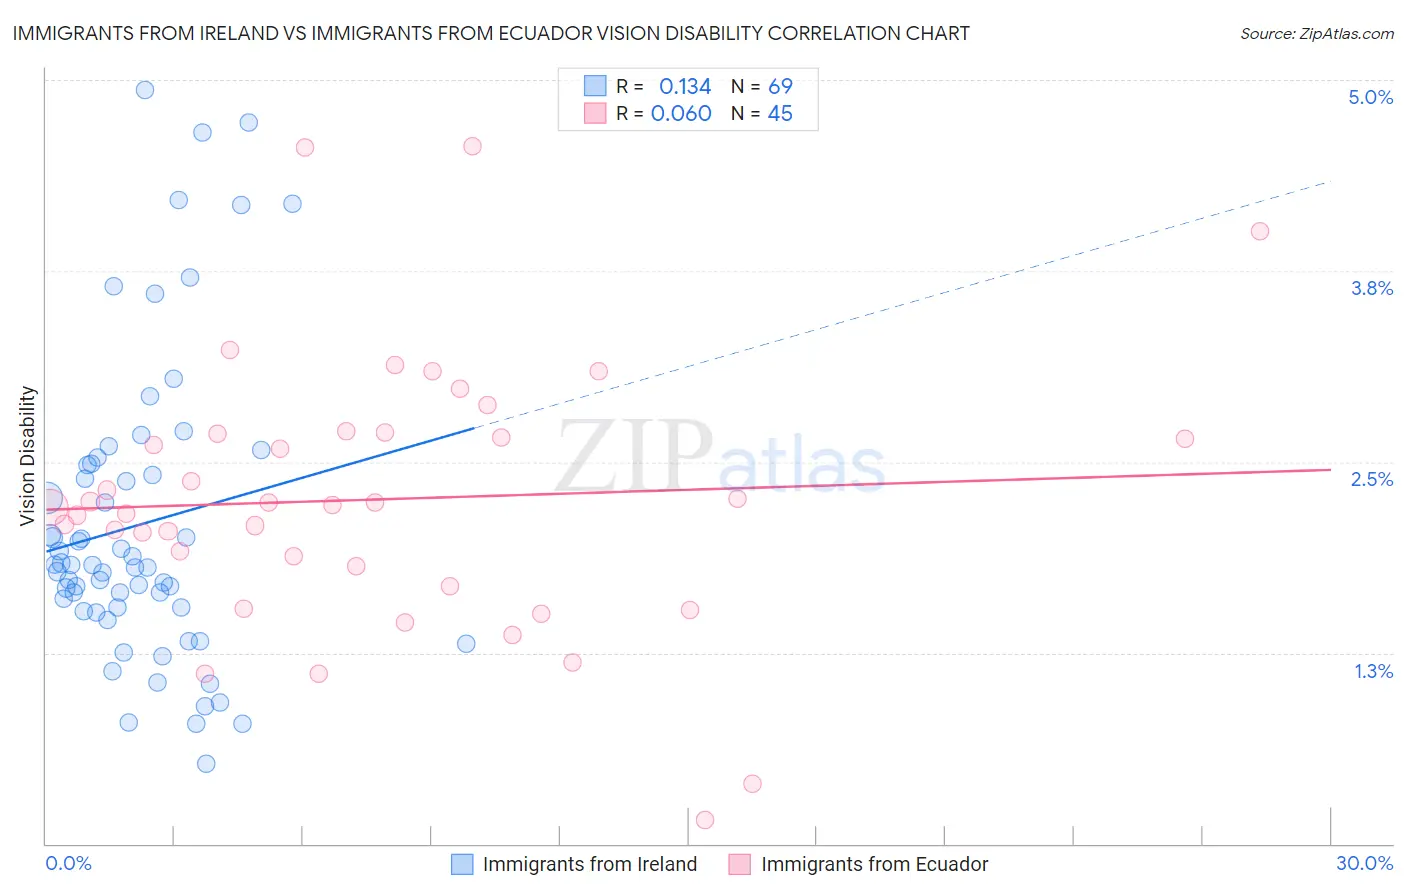
Immigrants from Ireland vs Immigrants from Ecuador Vision Disability Correlation Chart
The statistical analysis conducted on geographies consisting of 240,640,938 people shows a poor positive correlation between the proportion of Immigrants from Ireland and percentage of population with vision disability in the United States with a correlation coefficient (R) of 0.134 and weighted average of 2.0%. Similarly, the statistical analysis conducted on geographies consisting of 270,800,237 people shows a slight positive correlation between the proportion of Immigrants from Ecuador and percentage of population with vision disability in the United States with a correlation coefficient (R) of 0.060 and weighted average of 2.3%, a difference of 16.9%.
Vision Disability Correlation Summary
| Measurement | Immigrants from Ireland | Immigrants from Ecuador |
| Minimum | 0.52% | 0.16% |
| Maximum | 4.9% | 4.6% |
| Range | 4.4% | 4.4% |
| Mean | 2.1% | 2.3% |
| Median | 1.8% | 2.2% |
| Interquartile 25% (IQ1) | 1.5% | 1.8% |
| Interquartile 75% (IQ3) | 2.5% | 2.7% |
| Interquartile Range (IQR) | 0.95% | 0.94% |
| Standard Deviation (Sample) | 0.99% | 0.89% |
| Standard Deviation (Population) | 0.98% | 0.88% |
Similar Demographics by Vision Disability
Demographics Similar to Immigrants from Ireland by Vision Disability
In terms of vision disability, the demographic groups most similar to Immigrants from Ireland are Cypriot (2.0%, a difference of 0.030%), Immigrants from Ethiopia (2.0%, a difference of 0.18%), Zimbabwean (2.0%, a difference of 0.20%), Eastern European (2.0%, a difference of 0.24%), and Immigrants from Kuwait (2.0%, a difference of 0.26%).
| Demographics | Rating | Rank | Vision Disability |
| Immigrants | Egypt | 99.9 /100 | #33 | Exceptional 1.9% |
| Immigrants | Turkey | 99.8 /100 | #34 | Exceptional 1.9% |
| Immigrants | Australia | 99.8 /100 | #35 | Exceptional 1.9% |
| Cambodians | 99.8 /100 | #36 | Exceptional 2.0% |
| Bhutanese | 99.8 /100 | #37 | Exceptional 2.0% |
| Immigrants | Kuwait | 99.8 /100 | #38 | Exceptional 2.0% |
| Zimbabweans | 99.7 /100 | #39 | Exceptional 2.0% |
| Immigrants | Ireland | 99.7 /100 | #40 | Exceptional 2.0% |
| Cypriots | 99.7 /100 | #41 | Exceptional 2.0% |
| Immigrants | Ethiopia | 99.7 /100 | #42 | Exceptional 2.0% |
| Eastern Europeans | 99.7 /100 | #43 | Exceptional 2.0% |
| Immigrants | Indonesia | 99.7 /100 | #44 | Exceptional 2.0% |
| Ethiopians | 99.7 /100 | #45 | Exceptional 2.0% |
| Immigrants | Sweden | 99.7 /100 | #46 | Exceptional 2.0% |
| Immigrants | Bulgaria | 99.7 /100 | #47 | Exceptional 2.0% |
Demographics Similar to Immigrants from Ecuador by Vision Disability
In terms of vision disability, the demographic groups most similar to Immigrants from Ecuador are Nicaraguan (2.3%, a difference of 0.16%), German Russian (2.3%, a difference of 0.19%), Central American (2.3%, a difference of 0.20%), Welsh (2.3%, a difference of 0.23%), and Hmong (2.3%, a difference of 0.31%).
| Demographics | Rating | Rank | Vision Disability |
| Irish | 3.4 /100 | #224 | Tragic 2.3% |
| Immigrants | Western Africa | 3.4 /100 | #225 | Tragic 2.3% |
| Immigrants | Germany | 3.0 /100 | #226 | Tragic 2.3% |
| Hawaiians | 2.9 /100 | #227 | Tragic 2.3% |
| Hmong | 2.5 /100 | #228 | Tragic 2.3% |
| Welsh | 2.3 /100 | #229 | Tragic 2.3% |
| Nicaraguans | 2.2 /100 | #230 | Tragic 2.3% |
| Immigrants | Ecuador | 2.0 /100 | #231 | Tragic 2.3% |
| German Russians | 1.8 /100 | #232 | Tragic 2.3% |
| Central Americans | 1.8 /100 | #233 | Tragic 2.3% |
| Scottish | 1.6 /100 | #234 | Tragic 2.3% |
| Marshallese | 1.5 /100 | #235 | Tragic 2.3% |
| Immigrants | Congo | 1.4 /100 | #236 | Tragic 2.3% |
| Immigrants | Portugal | 1.4 /100 | #237 | Tragic 2.3% |
| Immigrants | Cambodia | 1.1 /100 | #238 | Tragic 2.3% |