Immigrants from Ireland vs Immigrants from South America Vision Disability
COMPARE
Immigrants from Ireland
Immigrants from South America
Vision Disability
Vision Disability Comparison
Immigrants from Ireland
Immigrants from South America
2.0%
VISION DISABILITY
99.7/ 100
METRIC RATING
40th/ 347
METRIC RANK
2.1%
VISION DISABILITY
73.8/ 100
METRIC RATING
153rd/ 347
METRIC RANK
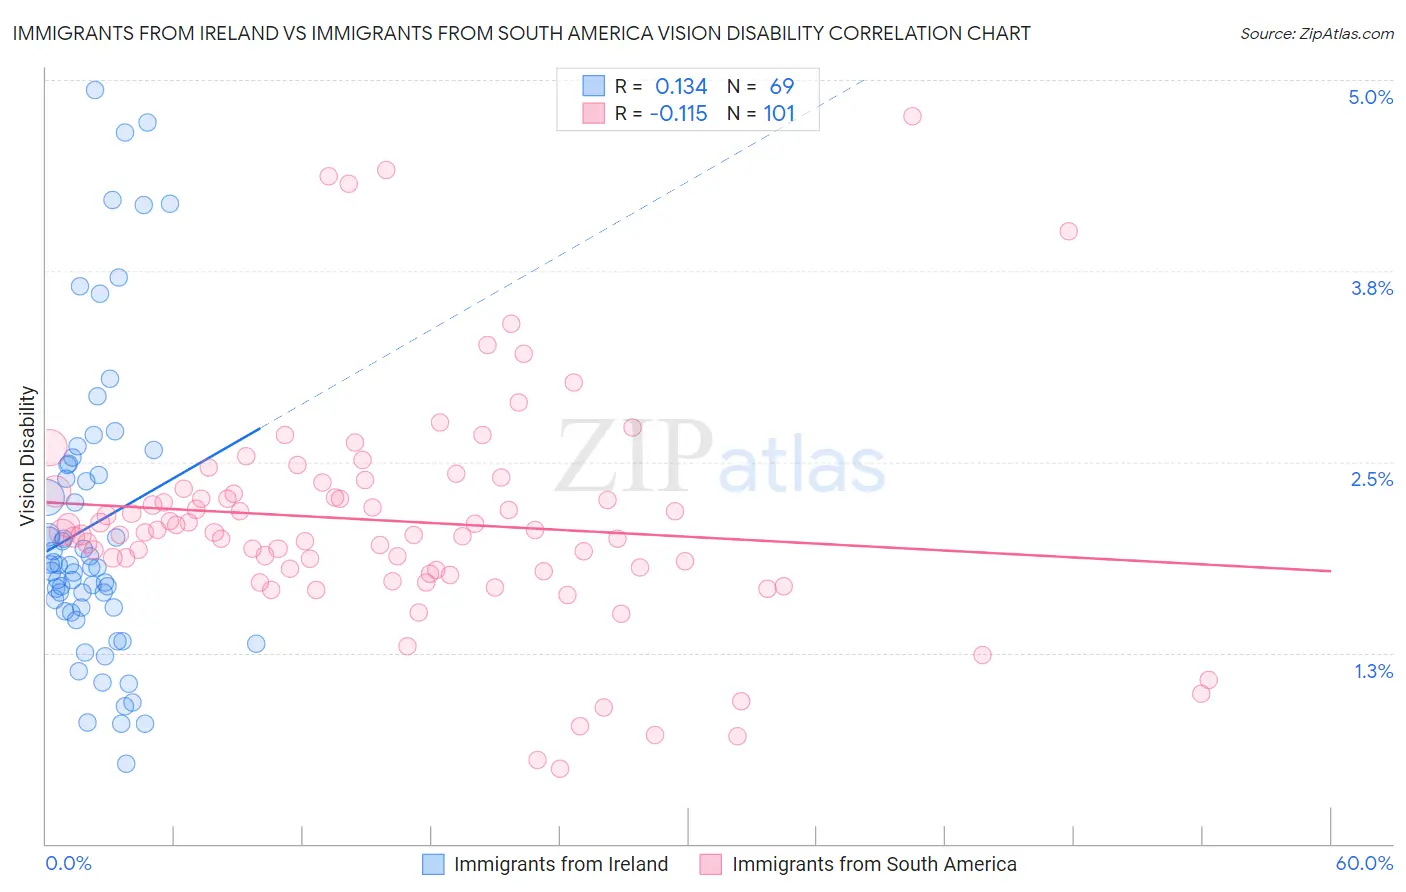
Immigrants from Ireland vs Immigrants from South America Vision Disability Correlation Chart
The statistical analysis conducted on geographies consisting of 240,640,938 people shows a poor positive correlation between the proportion of Immigrants from Ireland and percentage of population with vision disability in the United States with a correlation coefficient (R) of 0.134 and weighted average of 2.0%. Similarly, the statistical analysis conducted on geographies consisting of 485,713,263 people shows a poor negative correlation between the proportion of Immigrants from South America and percentage of population with vision disability in the United States with a correlation coefficient (R) of -0.115 and weighted average of 2.1%, a difference of 8.4%.
Vision Disability Correlation Summary
| Measurement | Immigrants from Ireland | Immigrants from South America |
| Minimum | 0.52% | 0.49% |
| Maximum | 4.9% | 4.8% |
| Range | 4.4% | 4.3% |
| Mean | 2.1% | 2.1% |
| Median | 1.8% | 2.0% |
| Interquartile 25% (IQ1) | 1.5% | 1.8% |
| Interquartile 75% (IQ3) | 2.5% | 2.3% |
| Interquartile Range (IQR) | 0.95% | 0.53% |
| Standard Deviation (Sample) | 0.99% | 0.75% |
| Standard Deviation (Population) | 0.98% | 0.74% |
Similar Demographics by Vision Disability
Demographics Similar to Immigrants from Ireland by Vision Disability
In terms of vision disability, the demographic groups most similar to Immigrants from Ireland are Cypriot (2.0%, a difference of 0.030%), Immigrants from Ethiopia (2.0%, a difference of 0.18%), Zimbabwean (2.0%, a difference of 0.20%), Eastern European (2.0%, a difference of 0.24%), and Immigrants from Kuwait (2.0%, a difference of 0.26%).
| Demographics | Rating | Rank | Vision Disability |
| Immigrants | Egypt | 99.9 /100 | #33 | Exceptional 1.9% |
| Immigrants | Turkey | 99.8 /100 | #34 | Exceptional 1.9% |
| Immigrants | Australia | 99.8 /100 | #35 | Exceptional 1.9% |
| Cambodians | 99.8 /100 | #36 | Exceptional 2.0% |
| Bhutanese | 99.8 /100 | #37 | Exceptional 2.0% |
| Immigrants | Kuwait | 99.8 /100 | #38 | Exceptional 2.0% |
| Zimbabweans | 99.7 /100 | #39 | Exceptional 2.0% |
| Immigrants | Ireland | 99.7 /100 | #40 | Exceptional 2.0% |
| Cypriots | 99.7 /100 | #41 | Exceptional 2.0% |
| Immigrants | Ethiopia | 99.7 /100 | #42 | Exceptional 2.0% |
| Eastern Europeans | 99.7 /100 | #43 | Exceptional 2.0% |
| Immigrants | Indonesia | 99.7 /100 | #44 | Exceptional 2.0% |
| Ethiopians | 99.7 /100 | #45 | Exceptional 2.0% |
| Immigrants | Sweden | 99.7 /100 | #46 | Exceptional 2.0% |
| Immigrants | Bulgaria | 99.7 /100 | #47 | Exceptional 2.0% |
Demographics Similar to Immigrants from South America by Vision Disability
In terms of vision disability, the demographic groups most similar to Immigrants from South America are Slovene (2.1%, a difference of 0.010%), Immigrants from Southern Europe (2.1%, a difference of 0.070%), Immigrants from Colombia (2.1%, a difference of 0.14%), Immigrants from Norway (2.1%, a difference of 0.15%), and Pakistani (2.1%, a difference of 0.17%).
| Demographics | Rating | Rank | Vision Disability |
| Italians | 79.7 /100 | #146 | Good 2.1% |
| Immigrants | Sudan | 78.4 /100 | #147 | Good 2.1% |
| Finns | 78.3 /100 | #148 | Good 2.1% |
| Colombians | 76.2 /100 | #149 | Good 2.1% |
| Belgians | 75.9 /100 | #150 | Good 2.1% |
| Immigrants | Norway | 75.5 /100 | #151 | Good 2.1% |
| Immigrants | Southern Europe | 74.6 /100 | #152 | Good 2.1% |
| Immigrants | South America | 73.8 /100 | #153 | Good 2.1% |
| Slovenes | 73.6 /100 | #154 | Good 2.1% |
| Immigrants | Colombia | 72.1 /100 | #155 | Good 2.1% |
| Pakistanis | 71.6 /100 | #156 | Good 2.1% |
| Serbians | 70.2 /100 | #157 | Good 2.1% |
| Immigrants | Uzbekistan | 69.9 /100 | #158 | Good 2.1% |
| South Africans | 69.8 /100 | #159 | Good 2.1% |
| Austrians | 69.0 /100 | #160 | Good 2.1% |