Immigrants from Iraq vs Somali Disability Age 5 to 17
COMPARE
Immigrants from Iraq
Somali
Disability Age 5 to 17
Disability Age 5 to 17 Comparison
Immigrants from Iraq
Somalis
5.6%
DISABILITY AGE 5 TO 17
53.9/ 100
METRIC RATING
171st/ 347
METRIC RANK
5.9%
DISABILITY AGE 5 TO 17
0.8/ 100
METRIC RATING
260th/ 347
METRIC RANK
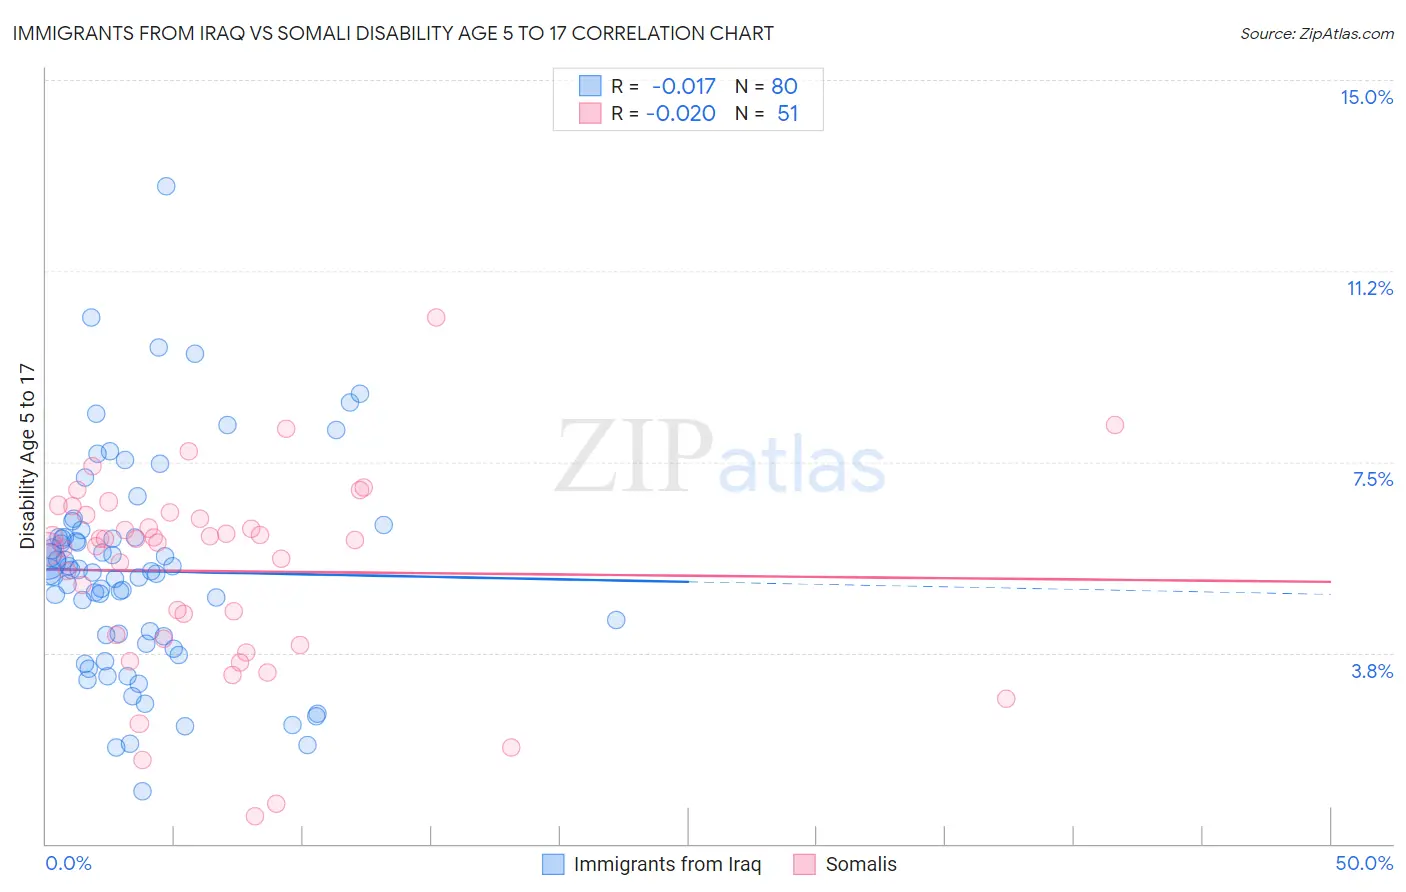
Immigrants from Iraq vs Somali Disability Age 5 to 17 Correlation Chart
The statistical analysis conducted on geographies consisting of 194,133,073 people shows no correlation between the proportion of Immigrants from Iraq and percentage of population with a disability between the ages 5 and 17 in the United States with a correlation coefficient (R) of -0.017 and weighted average of 5.6%. Similarly, the statistical analysis conducted on geographies consisting of 99,029,276 people shows no correlation between the proportion of Somalis and percentage of population with a disability between the ages 5 and 17 in the United States with a correlation coefficient (R) of -0.020 and weighted average of 5.9%, a difference of 6.2%.
Disability Age 5 to 17 Correlation Summary
| Measurement | Immigrants from Iraq | Somali |
| Minimum | 1.0% | 0.54% |
| Maximum | 12.9% | 10.3% |
| Range | 11.9% | 9.8% |
| Mean | 5.4% | 5.4% |
| Median | 5.3% | 6.0% |
| Interquartile 25% (IQ1) | 4.0% | 4.0% |
| Interquartile 75% (IQ3) | 6.0% | 6.5% |
| Interquartile Range (IQR) | 2.0% | 2.4% |
| Standard Deviation (Sample) | 2.1% | 1.9% |
| Standard Deviation (Population) | 2.1% | 1.9% |
Similar Demographics by Disability Age 5 to 17
Demographics Similar to Immigrants from Iraq by Disability Age 5 to 17
In terms of disability age 5 to 17, the demographic groups most similar to Immigrants from Iraq are Serbian (5.6%, a difference of 0.0%), Immigrants from Norway (5.6%, a difference of 0.090%), Iraqi (5.6%, a difference of 0.11%), Ukrainian (5.6%, a difference of 0.12%), and Uruguayan (5.6%, a difference of 0.15%).
| Demographics | Rating | Rank | Disability Age 5 to 17 |
| Immigrants | Scotland | 61.9 /100 | #164 | Good 5.6% |
| Lebanese | 61.4 /100 | #165 | Good 5.6% |
| Greeks | 60.6 /100 | #166 | Good 5.6% |
| Immigrants | Burma/Myanmar | 59.3 /100 | #167 | Average 5.6% |
| Iraqis | 56.0 /100 | #168 | Average 5.6% |
| Immigrants | Norway | 55.7 /100 | #169 | Average 5.6% |
| Serbians | 54.0 /100 | #170 | Average 5.6% |
| Immigrants | Iraq | 53.9 /100 | #171 | Average 5.6% |
| Ukrainians | 51.5 /100 | #172 | Average 5.6% |
| Uruguayans | 51.0 /100 | #173 | Average 5.6% |
| Costa Ricans | 50.0 /100 | #174 | Average 5.6% |
| Shoshone | 49.4 /100 | #175 | Average 5.6% |
| Immigrants | Central America | 49.4 /100 | #176 | Average 5.6% |
| Immigrants | Western Europe | 47.8 /100 | #177 | Average 5.6% |
| Immigrants | Trinidad and Tobago | 47.6 /100 | #178 | Average 5.6% |
Demographics Similar to Somalis by Disability Age 5 to 17
In terms of disability age 5 to 17, the demographic groups most similar to Somalis are Immigrants from Middle Africa (5.9%, a difference of 0.070%), Immigrants from Western Africa (5.9%, a difference of 0.10%), Slavic (5.9%, a difference of 0.13%), Czechoslovakian (5.9%, a difference of 0.18%), and Brazilian (5.9%, a difference of 0.19%).
| Demographics | Rating | Rank | Disability Age 5 to 17 |
| Scandinavians | 1.4 /100 | #253 | Tragic 5.9% |
| Barbadians | 1.3 /100 | #254 | Tragic 5.9% |
| Italians | 1.2 /100 | #255 | Tragic 5.9% |
| Hopi | 1.0 /100 | #256 | Tragic 5.9% |
| Hispanics or Latinos | 1.0 /100 | #257 | Tragic 5.9% |
| Brazilians | 0.9 /100 | #258 | Tragic 5.9% |
| Slavs | 0.9 /100 | #259 | Tragic 5.9% |
| Somalis | 0.8 /100 | #260 | Tragic 5.9% |
| Immigrants | Middle Africa | 0.7 /100 | #261 | Tragic 5.9% |
| Immigrants | Western Africa | 0.7 /100 | #262 | Tragic 5.9% |
| Czechoslovakians | 0.7 /100 | #263 | Tragic 5.9% |
| Canadians | 0.6 /100 | #264 | Tragic 6.0% |
| Panamanians | 0.6 /100 | #265 | Tragic 6.0% |
| Slovenes | 0.6 /100 | #266 | Tragic 6.0% |
| Spanish | 0.5 /100 | #267 | Tragic 6.0% |