Immigrants from Iraq vs Immigrants from Panama Disability Age 5 to 17
COMPARE
Immigrants from Iraq
Immigrants from Panama
Disability Age 5 to 17
Disability Age 5 to 17 Comparison
Immigrants from Iraq
Immigrants from Panama
5.6%
DISABILITY AGE 5 TO 17
53.9/ 100
METRIC RATING
171st/ 347
METRIC RANK
5.8%
DISABILITY AGE 5 TO 17
8.7/ 100
METRIC RATING
212th/ 347
METRIC RANK
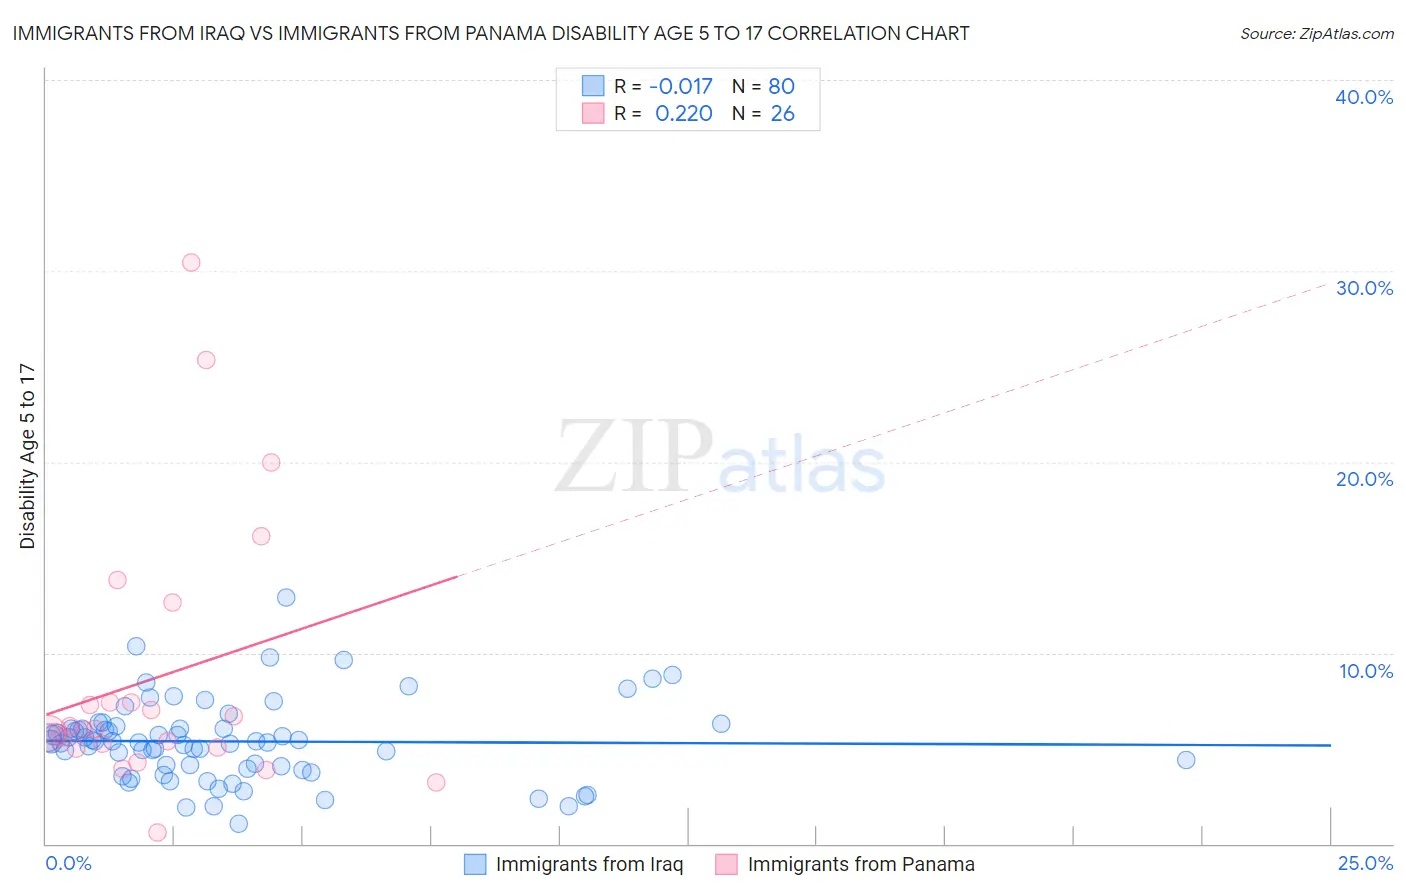
Immigrants from Iraq vs Immigrants from Panama Disability Age 5 to 17 Correlation Chart
The statistical analysis conducted on geographies consisting of 194,133,073 people shows no correlation between the proportion of Immigrants from Iraq and percentage of population with a disability between the ages 5 and 17 in the United States with a correlation coefficient (R) of -0.017 and weighted average of 5.6%. Similarly, the statistical analysis conducted on geographies consisting of 220,612,893 people shows a weak positive correlation between the proportion of Immigrants from Panama and percentage of population with a disability between the ages 5 and 17 in the United States with a correlation coefficient (R) of 0.220 and weighted average of 5.8%, a difference of 3.1%.
Disability Age 5 to 17 Correlation Summary
| Measurement | Immigrants from Iraq | Immigrants from Panama |
| Minimum | 1.0% | 0.56% |
| Maximum | 12.9% | 30.4% |
| Range | 11.9% | 29.9% |
| Mean | 5.4% | 8.7% |
| Median | 5.3% | 6.0% |
| Interquartile 25% (IQ1) | 4.0% | 5.0% |
| Interquartile 75% (IQ3) | 6.0% | 7.4% |
| Interquartile Range (IQR) | 2.0% | 2.4% |
| Standard Deviation (Sample) | 2.1% | 7.1% |
| Standard Deviation (Population) | 2.1% | 6.9% |
Similar Demographics by Disability Age 5 to 17
Demographics Similar to Immigrants from Iraq by Disability Age 5 to 17
In terms of disability age 5 to 17, the demographic groups most similar to Immigrants from Iraq are Serbian (5.6%, a difference of 0.0%), Immigrants from Norway (5.6%, a difference of 0.090%), Iraqi (5.6%, a difference of 0.11%), Ukrainian (5.6%, a difference of 0.12%), and Uruguayan (5.6%, a difference of 0.15%).
| Demographics | Rating | Rank | Disability Age 5 to 17 |
| Immigrants | Scotland | 61.9 /100 | #164 | Good 5.6% |
| Lebanese | 61.4 /100 | #165 | Good 5.6% |
| Greeks | 60.6 /100 | #166 | Good 5.6% |
| Immigrants | Burma/Myanmar | 59.3 /100 | #167 | Average 5.6% |
| Iraqis | 56.0 /100 | #168 | Average 5.6% |
| Immigrants | Norway | 55.7 /100 | #169 | Average 5.6% |
| Serbians | 54.0 /100 | #170 | Average 5.6% |
| Immigrants | Iraq | 53.9 /100 | #171 | Average 5.6% |
| Ukrainians | 51.5 /100 | #172 | Average 5.6% |
| Uruguayans | 51.0 /100 | #173 | Average 5.6% |
| Costa Ricans | 50.0 /100 | #174 | Average 5.6% |
| Shoshone | 49.4 /100 | #175 | Average 5.6% |
| Immigrants | Central America | 49.4 /100 | #176 | Average 5.6% |
| Immigrants | Western Europe | 47.8 /100 | #177 | Average 5.6% |
| Immigrants | Trinidad and Tobago | 47.6 /100 | #178 | Average 5.6% |
Demographics Similar to Immigrants from Panama by Disability Age 5 to 17
In terms of disability age 5 to 17, the demographic groups most similar to Immigrants from Panama are Immigrants from Cameroon (5.8%, a difference of 0.050%), Immigrants from Morocco (5.8%, a difference of 0.050%), Yugoslavian (5.8%, a difference of 0.070%), Swedish (5.8%, a difference of 0.090%), and Immigrants from Haiti (5.8%, a difference of 0.12%).
| Demographics | Rating | Rank | Disability Age 5 to 17 |
| Trinidadians and Tobagonians | 10.8 /100 | #205 | Poor 5.7% |
| Immigrants | Africa | 10.8 /100 | #206 | Poor 5.7% |
| Moroccans | 10.4 /100 | #207 | Poor 5.7% |
| Kenyans | 10.0 /100 | #208 | Poor 5.8% |
| Immigrants | Uganda | 9.7 /100 | #209 | Tragic 5.8% |
| Immigrants | Haiti | 9.5 /100 | #210 | Tragic 5.8% |
| Yugoslavians | 9.1 /100 | #211 | Tragic 5.8% |
| Immigrants | Panama | 8.7 /100 | #212 | Tragic 5.8% |
| Immigrants | Cameroon | 8.3 /100 | #213 | Tragic 5.8% |
| Immigrants | Morocco | 8.3 /100 | #214 | Tragic 5.8% |
| Swedes | 8.1 /100 | #215 | Tragic 5.8% |
| Nigerians | 7.5 /100 | #216 | Tragic 5.8% |
| Czechs | 7.4 /100 | #217 | Tragic 5.8% |
| Immigrants | Sierra Leone | 7.1 /100 | #218 | Tragic 5.8% |
| Sierra Leoneans | 7.0 /100 | #219 | Tragic 5.8% |