Immigrants from Hungary vs Lebanese Disability Age 5 to 17
COMPARE
Immigrants from Hungary
Lebanese
Disability Age 5 to 17
Disability Age 5 to 17 Comparison
Immigrants from Hungary
Lebanese
5.5%
DISABILITY AGE 5 TO 17
87.9/ 100
METRIC RATING
143rd/ 347
METRIC RANK
5.6%
DISABILITY AGE 5 TO 17
61.4/ 100
METRIC RATING
165th/ 347
METRIC RANK
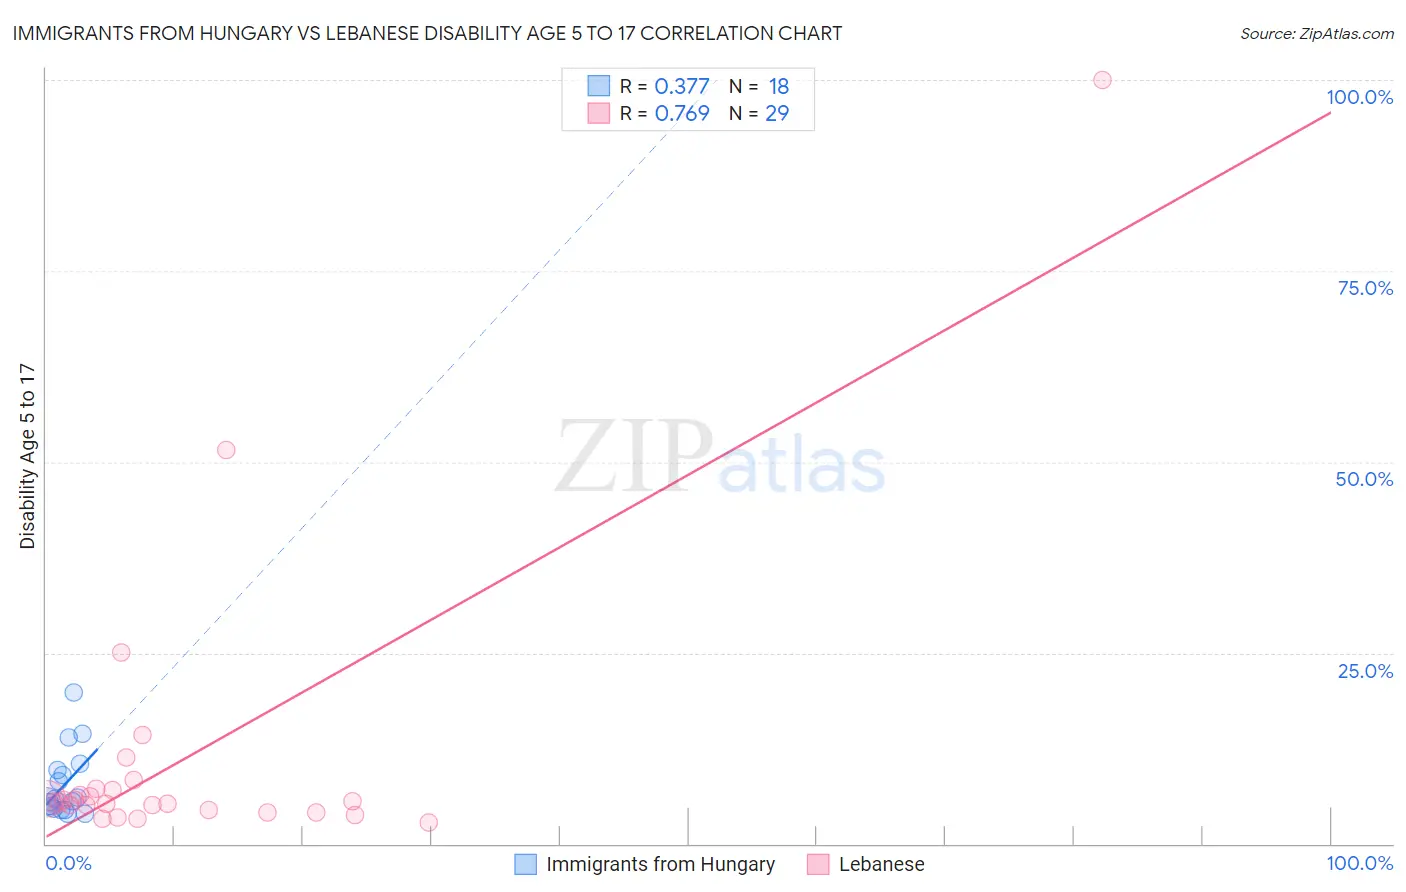
Immigrants from Hungary vs Lebanese Disability Age 5 to 17 Correlation Chart
The statistical analysis conducted on geographies consisting of 194,505,610 people shows a mild positive correlation between the proportion of Immigrants from Hungary and percentage of population with a disability between the ages 5 and 17 in the United States with a correlation coefficient (R) of 0.377 and weighted average of 5.5%. Similarly, the statistical analysis conducted on geographies consisting of 398,034,375 people shows a strong positive correlation between the proportion of Lebanese and percentage of population with a disability between the ages 5 and 17 in the United States with a correlation coefficient (R) of 0.769 and weighted average of 5.6%, a difference of 1.9%.
Disability Age 5 to 17 Correlation Summary
| Measurement | Immigrants from Hungary | Lebanese |
| Minimum | 3.9% | 2.9% |
| Maximum | 19.9% | 100.0% |
| Range | 16.0% | 97.1% |
| Mean | 7.8% | 11.2% |
| Median | 5.7% | 5.4% |
| Interquartile 25% (IQ1) | 4.5% | 4.3% |
| Interquartile 75% (IQ3) | 9.6% | 7.1% |
| Interquartile Range (IQR) | 5.1% | 2.8% |
| Standard Deviation (Sample) | 4.4% | 19.5% |
| Standard Deviation (Population) | 4.3% | 19.1% |
Similar Demographics by Disability Age 5 to 17
Demographics Similar to Immigrants from Hungary by Disability Age 5 to 17
In terms of disability age 5 to 17, the demographic groups most similar to Immigrants from Hungary are Colombian (5.5%, a difference of 0.020%), Pakistani (5.5%, a difference of 0.070%), Immigrants from Guatemala (5.5%, a difference of 0.14%), South American Indian (5.5%, a difference of 0.17%), and Immigrants from Netherlands (5.4%, a difference of 0.34%).
| Demographics | Rating | Rank | Disability Age 5 to 17 |
| Immigrants | Denmark | 91.4 /100 | #136 | Exceptional 5.4% |
| Navajo | 90.9 /100 | #137 | Exceptional 5.4% |
| Immigrants | Oceania | 90.8 /100 | #138 | Exceptional 5.4% |
| Belizeans | 90.8 /100 | #139 | Exceptional 5.4% |
| Immigrants | Netherlands | 90.5 /100 | #140 | Exceptional 5.4% |
| South American Indians | 89.3 /100 | #141 | Excellent 5.5% |
| Colombians | 88.0 /100 | #142 | Excellent 5.5% |
| Immigrants | Hungary | 87.9 /100 | #143 | Excellent 5.5% |
| Pakistanis | 87.3 /100 | #144 | Excellent 5.5% |
| Immigrants | Guatemala | 86.6 /100 | #145 | Excellent 5.5% |
| Albanians | 83.7 /100 | #146 | Excellent 5.5% |
| Immigrants | Albania | 83.1 /100 | #147 | Excellent 5.5% |
| Samoans | 81.9 /100 | #148 | Excellent 5.5% |
| Central Americans | 81.6 /100 | #149 | Excellent 5.5% |
| Guatemalans | 81.5 /100 | #150 | Excellent 5.5% |
Demographics Similar to Lebanese by Disability Age 5 to 17
In terms of disability age 5 to 17, the demographic groups most similar to Lebanese are Immigrants from Scotland (5.6%, a difference of 0.030%), Greek (5.6%, a difference of 0.040%), Immigrants from Burma/Myanmar (5.6%, a difference of 0.11%), Immigrants from Southern Europe (5.6%, a difference of 0.14%), and Iraqi (5.6%, a difference of 0.27%).
| Demographics | Rating | Rank | Disability Age 5 to 17 |
| Immigrants | Nepal | 77.1 /100 | #158 | Good 5.5% |
| Immigrants | Zimbabwe | 75.3 /100 | #159 | Good 5.5% |
| South Africans | 73.3 /100 | #160 | Good 5.5% |
| Immigrants | Saudi Arabia | 69.1 /100 | #161 | Good 5.5% |
| Zimbabweans | 67.2 /100 | #162 | Good 5.5% |
| Immigrants | Southern Europe | 64.0 /100 | #163 | Good 5.6% |
| Immigrants | Scotland | 61.9 /100 | #164 | Good 5.6% |
| Lebanese | 61.4 /100 | #165 | Good 5.6% |
| Greeks | 60.6 /100 | #166 | Good 5.6% |
| Immigrants | Burma/Myanmar | 59.3 /100 | #167 | Average 5.6% |
| Iraqis | 56.0 /100 | #168 | Average 5.6% |
| Immigrants | Norway | 55.7 /100 | #169 | Average 5.6% |
| Serbians | 54.0 /100 | #170 | Average 5.6% |
| Immigrants | Iraq | 53.9 /100 | #171 | Average 5.6% |
| Ukrainians | 51.5 /100 | #172 | Average 5.6% |