Immigrants from Guatemala vs Dutch West Indian Female Disability
COMPARE
Immigrants from Guatemala
Dutch West Indian
Female Disability
Female Disability Comparison
Immigrants from Guatemala
Dutch West Indians
12.1%
FEMALE DISABILITY
66.0/ 100
METRIC RATING
160th/ 347
METRIC RANK
15.0%
FEMALE DISABILITY
0.0/ 100
METRIC RATING
338th/ 347
METRIC RANK
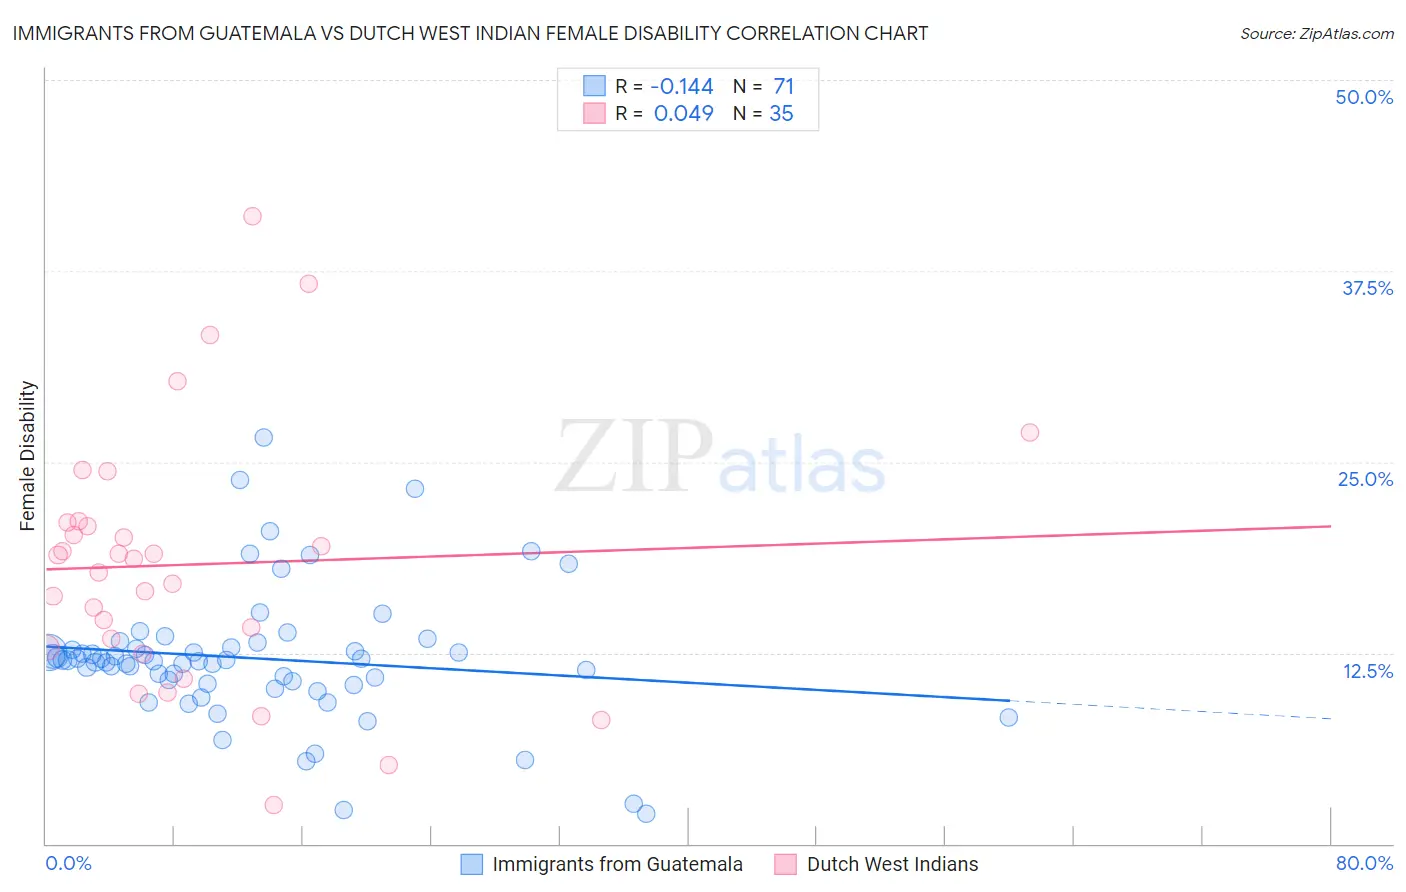
Immigrants from Guatemala vs Dutch West Indian Female Disability Correlation Chart
The statistical analysis conducted on geographies consisting of 377,228,850 people shows a poor negative correlation between the proportion of Immigrants from Guatemala and percentage of females with a disability in the United States with a correlation coefficient (R) of -0.144 and weighted average of 12.1%. Similarly, the statistical analysis conducted on geographies consisting of 85,770,005 people shows no correlation between the proportion of Dutch West Indians and percentage of females with a disability in the United States with a correlation coefficient (R) of 0.049 and weighted average of 15.0%, a difference of 23.8%.
Female Disability Correlation Summary
| Measurement | Immigrants from Guatemala | Dutch West Indian |
| Minimum | 2.0% | 2.6% |
| Maximum | 26.6% | 41.1% |
| Range | 24.7% | 38.5% |
| Mean | 12.1% | 18.3% |
| Median | 12.0% | 18.7% |
| Interquartile 25% (IQ1) | 10.5% | 12.8% |
| Interquartile 75% (IQ3) | 12.9% | 21.0% |
| Interquartile Range (IQR) | 2.4% | 8.2% |
| Standard Deviation (Sample) | 4.4% | 8.3% |
| Standard Deviation (Population) | 4.3% | 8.2% |
Similar Demographics by Female Disability
Demographics Similar to Immigrants from Guatemala by Female Disability
In terms of female disability, the demographic groups most similar to Immigrants from Guatemala are Guyanese (12.1%, a difference of 0.060%), Immigrants from Central America (12.1%, a difference of 0.070%), Immigrants from Ukraine (12.1%, a difference of 0.070%), Guatemalan (12.1%, a difference of 0.090%), and Czech (12.1%, a difference of 0.10%).
| Demographics | Rating | Rank | Female Disability |
| Sudanese | 79.1 /100 | #153 | Good 12.0% |
| Syrians | 76.9 /100 | #154 | Good 12.1% |
| Ghanaians | 76.6 /100 | #155 | Good 12.1% |
| Moroccans | 72.9 /100 | #156 | Good 12.1% |
| Danes | 72.5 /100 | #157 | Good 12.1% |
| Immigrants | Middle Africa | 72.4 /100 | #158 | Good 12.1% |
| Immigrants | Central America | 67.7 /100 | #159 | Good 12.1% |
| Immigrants | Guatemala | 66.0 /100 | #160 | Good 12.1% |
| Guyanese | 64.7 /100 | #161 | Good 12.1% |
| Immigrants | Ukraine | 64.3 /100 | #162 | Good 12.1% |
| Guatemalans | 63.8 /100 | #163 | Good 12.1% |
| Czechs | 63.6 /100 | #164 | Good 12.1% |
| Immigrants | Oceania | 61.8 /100 | #165 | Good 12.1% |
| Lithuanians | 59.5 /100 | #166 | Average 12.2% |
| Immigrants | Latin America | 59.0 /100 | #167 | Average 12.2% |
Demographics Similar to Dutch West Indians by Female Disability
In terms of female disability, the demographic groups most similar to Dutch West Indians are Tohono O'odham (15.0%, a difference of 0.14%), Seminole (15.0%, a difference of 0.26%), Colville (15.1%, a difference of 0.40%), Cajun (14.9%, a difference of 0.94%), and Cherokee (14.9%, a difference of 0.96%).
| Demographics | Rating | Rank | Female Disability |
| Immigrants | Cabo Verde | 0.0 /100 | #331 | Tragic 14.6% |
| Pima | 0.0 /100 | #332 | Tragic 14.8% |
| Immigrants | Azores | 0.0 /100 | #333 | Tragic 14.9% |
| Cherokee | 0.0 /100 | #334 | Tragic 14.9% |
| Cajuns | 0.0 /100 | #335 | Tragic 14.9% |
| Seminole | 0.0 /100 | #336 | Tragic 15.0% |
| Tohono O'odham | 0.0 /100 | #337 | Tragic 15.0% |
| Dutch West Indians | 0.0 /100 | #338 | Tragic 15.0% |
| Colville | 0.0 /100 | #339 | Tragic 15.1% |
| Chickasaw | 0.0 /100 | #340 | Tragic 15.2% |
| Choctaw | 0.0 /100 | #341 | Tragic 15.4% |
| Creek | 0.0 /100 | #342 | Tragic 15.7% |
| Lumbee | 0.0 /100 | #343 | Tragic 15.8% |
| Kiowa | 0.0 /100 | #344 | Tragic 15.8% |
| Puerto Ricans | 0.0 /100 | #345 | Tragic 16.6% |