Immigrants from Guatemala vs Immigrants from Denmark Female Disability
COMPARE
Immigrants from Guatemala
Immigrants from Denmark
Female Disability
Female Disability Comparison
Immigrants from Guatemala
Immigrants from Denmark
12.1%
FEMALE DISABILITY
66.0/ 100
METRIC RATING
160th/ 347
METRIC RANK
11.6%
FEMALE DISABILITY
99.5/ 100
METRIC RATING
87th/ 347
METRIC RANK
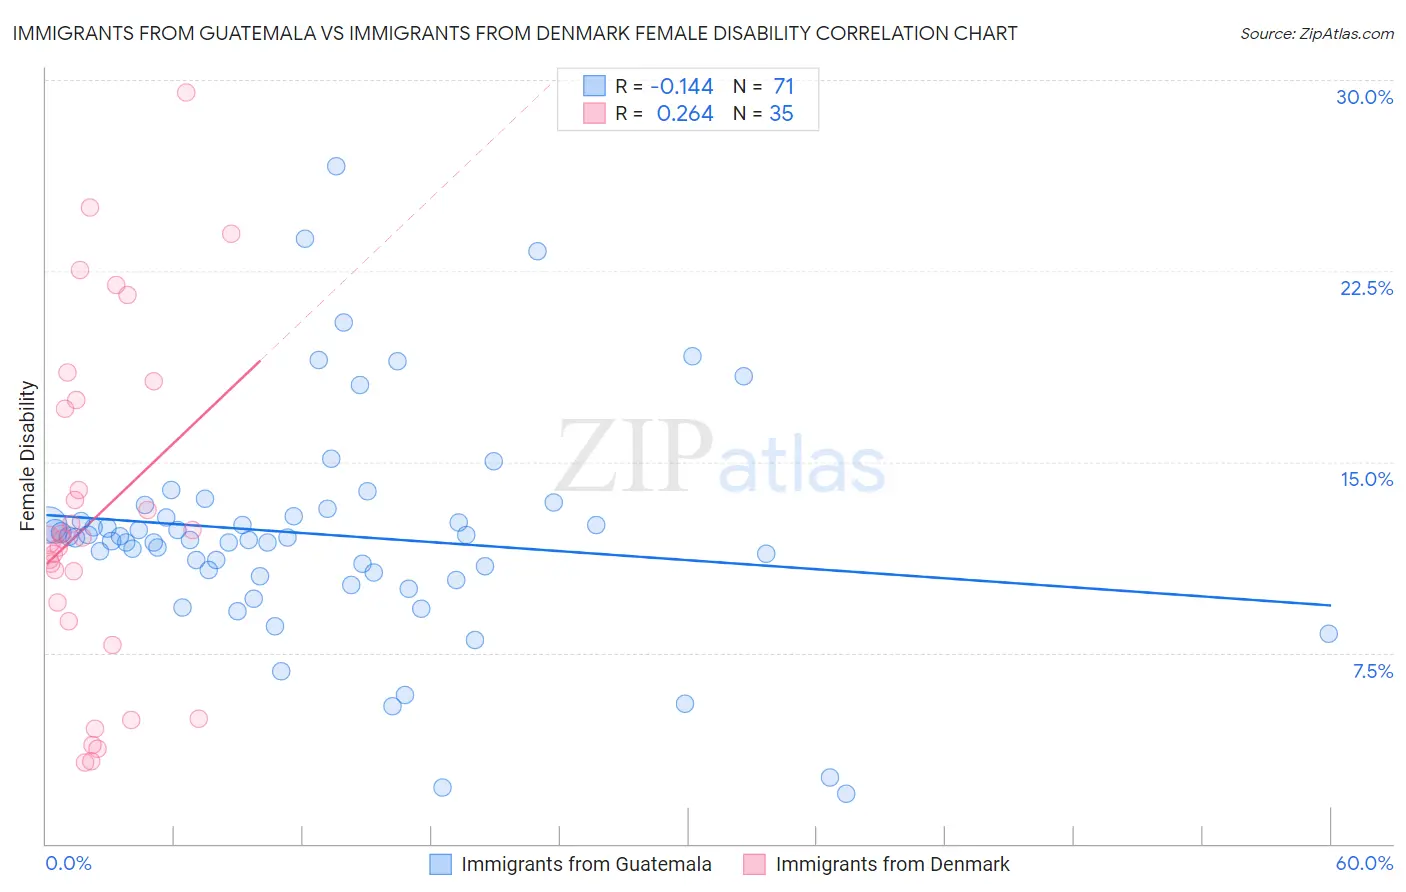
Immigrants from Guatemala vs Immigrants from Denmark Female Disability Correlation Chart
The statistical analysis conducted on geographies consisting of 377,228,850 people shows a poor negative correlation between the proportion of Immigrants from Guatemala and percentage of females with a disability in the United States with a correlation coefficient (R) of -0.144 and weighted average of 12.1%. Similarly, the statistical analysis conducted on geographies consisting of 136,431,190 people shows a weak positive correlation between the proportion of Immigrants from Denmark and percentage of females with a disability in the United States with a correlation coefficient (R) of 0.264 and weighted average of 11.6%, a difference of 4.7%.
Female Disability Correlation Summary
| Measurement | Immigrants from Guatemala | Immigrants from Denmark |
| Minimum | 2.0% | 3.2% |
| Maximum | 26.6% | 29.5% |
| Range | 24.7% | 26.3% |
| Mean | 12.1% | 12.9% |
| Median | 12.0% | 12.0% |
| Interquartile 25% (IQ1) | 10.5% | 8.7% |
| Interquartile 75% (IQ3) | 12.9% | 17.4% |
| Interquartile Range (IQR) | 2.4% | 8.7% |
| Standard Deviation (Sample) | 4.4% | 6.7% |
| Standard Deviation (Population) | 4.3% | 6.6% |
Similar Demographics by Female Disability
Demographics Similar to Immigrants from Guatemala by Female Disability
In terms of female disability, the demographic groups most similar to Immigrants from Guatemala are Guyanese (12.1%, a difference of 0.060%), Immigrants from Central America (12.1%, a difference of 0.070%), Immigrants from Ukraine (12.1%, a difference of 0.070%), Guatemalan (12.1%, a difference of 0.090%), and Czech (12.1%, a difference of 0.10%).
| Demographics | Rating | Rank | Female Disability |
| Sudanese | 79.1 /100 | #153 | Good 12.0% |
| Syrians | 76.9 /100 | #154 | Good 12.1% |
| Ghanaians | 76.6 /100 | #155 | Good 12.1% |
| Moroccans | 72.9 /100 | #156 | Good 12.1% |
| Danes | 72.5 /100 | #157 | Good 12.1% |
| Immigrants | Middle Africa | 72.4 /100 | #158 | Good 12.1% |
| Immigrants | Central America | 67.7 /100 | #159 | Good 12.1% |
| Immigrants | Guatemala | 66.0 /100 | #160 | Good 12.1% |
| Guyanese | 64.7 /100 | #161 | Good 12.1% |
| Immigrants | Ukraine | 64.3 /100 | #162 | Good 12.1% |
| Guatemalans | 63.8 /100 | #163 | Good 12.1% |
| Czechs | 63.6 /100 | #164 | Good 12.1% |
| Immigrants | Oceania | 61.8 /100 | #165 | Good 12.1% |
| Lithuanians | 59.5 /100 | #166 | Average 12.2% |
| Immigrants | Latin America | 59.0 /100 | #167 | Average 12.2% |
Demographics Similar to Immigrants from Denmark by Female Disability
In terms of female disability, the demographic groups most similar to Immigrants from Denmark are Yup'ik (11.6%, a difference of 0.0%), Palestinian (11.6%, a difference of 0.070%), Immigrants from Cameroon (11.6%, a difference of 0.070%), Immigrants from Poland (11.6%, a difference of 0.10%), and Vietnamese (11.6%, a difference of 0.10%).
| Demographics | Rating | Rank | Female Disability |
| Immigrants | Jordan | 99.7 /100 | #80 | Exceptional 11.5% |
| Eastern Europeans | 99.7 /100 | #81 | Exceptional 11.5% |
| Luxembourgers | 99.6 /100 | #82 | Exceptional 11.6% |
| Immigrants | Serbia | 99.6 /100 | #83 | Exceptional 11.6% |
| Immigrants | Poland | 99.6 /100 | #84 | Exceptional 11.6% |
| Palestinians | 99.6 /100 | #85 | Exceptional 11.6% |
| Immigrants | Cameroon | 99.6 /100 | #86 | Exceptional 11.6% |
| Immigrants | Denmark | 99.5 /100 | #87 | Exceptional 11.6% |
| Yup'ik | 99.5 /100 | #88 | Exceptional 11.6% |
| Vietnamese | 99.5 /100 | #89 | Exceptional 11.6% |
| Immigrants | Romania | 99.5 /100 | #90 | Exceptional 11.6% |
| Immigrants | Zimbabwe | 99.5 /100 | #91 | Exceptional 11.6% |
| Immigrants | Czechoslovakia | 99.5 /100 | #92 | Exceptional 11.6% |
| Immigrants | Sierra Leone | 99.4 /100 | #93 | Exceptional 11.6% |
| Immigrants | Brazil | 99.4 /100 | #94 | Exceptional 11.6% |