Immigrants from Asia vs Dutch West Indian Female Disability
COMPARE
Immigrants from Asia
Dutch West Indian
Female Disability
Female Disability Comparison
Immigrants from Asia
Dutch West Indians
11.0%
FEMALE DISABILITY
100.0/ 100
METRIC RATING
25th/ 347
METRIC RANK
15.0%
FEMALE DISABILITY
0.0/ 100
METRIC RATING
338th/ 347
METRIC RANK
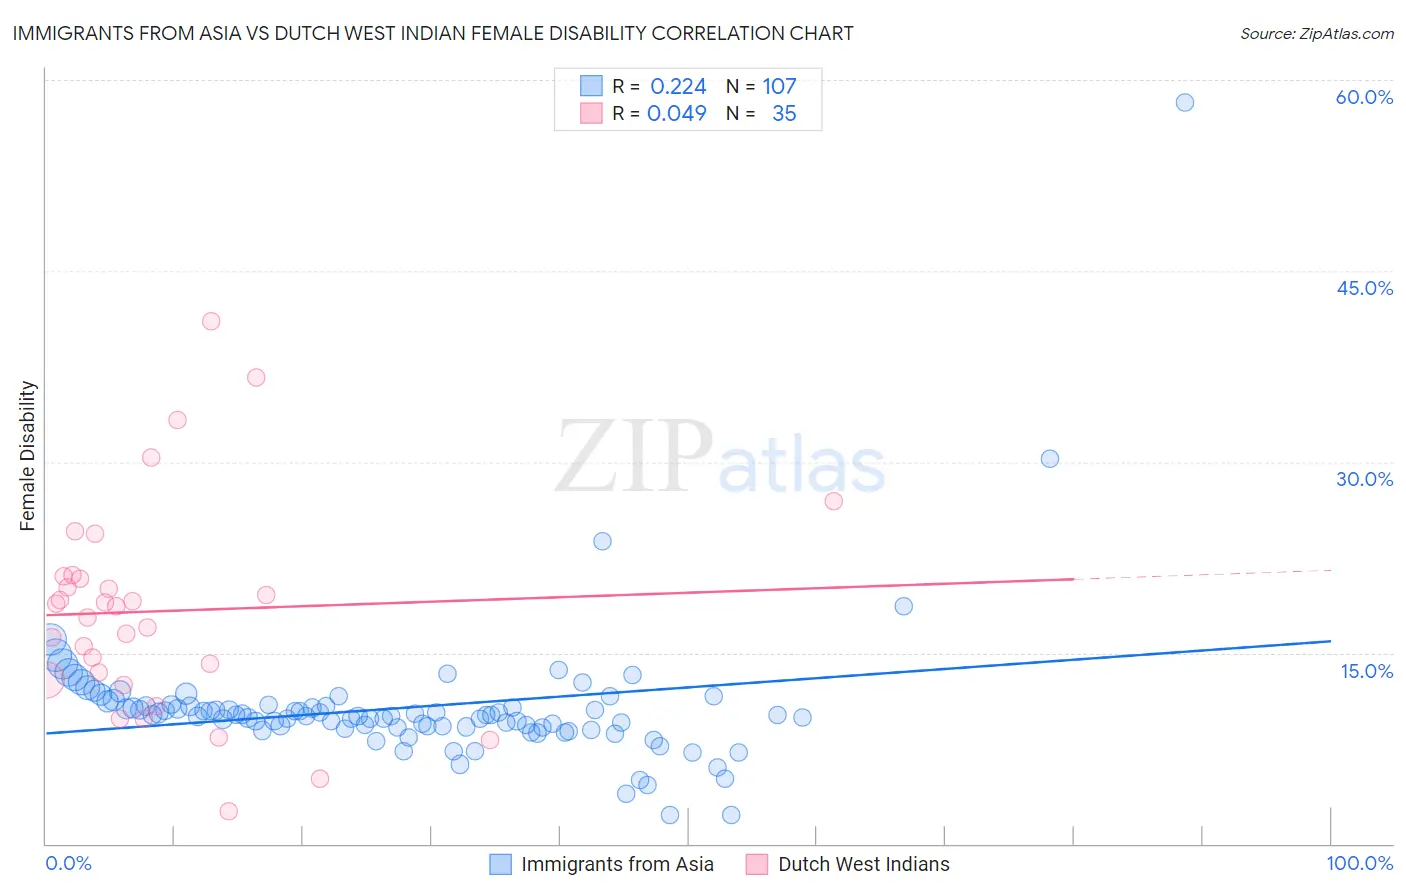
Immigrants from Asia vs Dutch West Indian Female Disability Correlation Chart
The statistical analysis conducted on geographies consisting of 548,970,010 people shows a weak positive correlation between the proportion of Immigrants from Asia and percentage of females with a disability in the United States with a correlation coefficient (R) of 0.224 and weighted average of 11.0%. Similarly, the statistical analysis conducted on geographies consisting of 85,770,005 people shows no correlation between the proportion of Dutch West Indians and percentage of females with a disability in the United States with a correlation coefficient (R) of 0.049 and weighted average of 15.0%, a difference of 36.2%.
Female Disability Correlation Summary
| Measurement | Immigrants from Asia | Dutch West Indian |
| Minimum | 2.2% | 2.6% |
| Maximum | 58.2% | 41.1% |
| Range | 56.0% | 38.5% |
| Mean | 10.7% | 18.3% |
| Median | 10.1% | 18.7% |
| Interquartile 25% (IQ1) | 9.2% | 12.8% |
| Interquartile 75% (IQ3) | 10.8% | 21.0% |
| Interquartile Range (IQR) | 1.7% | 8.2% |
| Standard Deviation (Sample) | 5.7% | 8.3% |
| Standard Deviation (Population) | 5.7% | 8.2% |
Similar Demographics by Female Disability
Demographics Similar to Immigrants from Asia by Female Disability
In terms of female disability, the demographic groups most similar to Immigrants from Asia are Immigrants from Argentina (11.0%, a difference of 0.030%), Argentinean (11.0%, a difference of 0.040%), Immigrants from Turkey (11.1%, a difference of 0.44%), Venezuelan (11.0%, a difference of 0.59%), and Egyptian (11.1%, a difference of 0.72%).
| Demographics | Rating | Rank | Female Disability |
| Immigrants | Iran | 100.0 /100 | #18 | Exceptional 10.8% |
| Immigrants | Venezuela | 100.0 /100 | #19 | Exceptional 10.9% |
| Immigrants | Pakistan | 100.0 /100 | #20 | Exceptional 10.9% |
| Asians | 100.0 /100 | #21 | Exceptional 10.9% |
| Immigrants | Sri Lanka | 100.0 /100 | #22 | Exceptional 10.9% |
| Venezuelans | 100.0 /100 | #23 | Exceptional 11.0% |
| Immigrants | Argentina | 100.0 /100 | #24 | Exceptional 11.0% |
| Immigrants | Asia | 100.0 /100 | #25 | Exceptional 11.0% |
| Argentineans | 100.0 /100 | #26 | Exceptional 11.0% |
| Immigrants | Turkey | 100.0 /100 | #27 | Exceptional 11.1% |
| Egyptians | 100.0 /100 | #28 | Exceptional 11.1% |
| Immigrants | Malaysia | 100.0 /100 | #29 | Exceptional 11.1% |
| Turks | 100.0 /100 | #30 | Exceptional 11.1% |
| Immigrants | Kuwait | 100.0 /100 | #31 | Exceptional 11.1% |
| Immigrants | Australia | 100.0 /100 | #32 | Exceptional 11.1% |
Demographics Similar to Dutch West Indians by Female Disability
In terms of female disability, the demographic groups most similar to Dutch West Indians are Tohono O'odham (15.0%, a difference of 0.14%), Seminole (15.0%, a difference of 0.26%), Colville (15.1%, a difference of 0.40%), Cajun (14.9%, a difference of 0.94%), and Cherokee (14.9%, a difference of 0.96%).
| Demographics | Rating | Rank | Female Disability |
| Immigrants | Cabo Verde | 0.0 /100 | #331 | Tragic 14.6% |
| Pima | 0.0 /100 | #332 | Tragic 14.8% |
| Immigrants | Azores | 0.0 /100 | #333 | Tragic 14.9% |
| Cherokee | 0.0 /100 | #334 | Tragic 14.9% |
| Cajuns | 0.0 /100 | #335 | Tragic 14.9% |
| Seminole | 0.0 /100 | #336 | Tragic 15.0% |
| Tohono O'odham | 0.0 /100 | #337 | Tragic 15.0% |
| Dutch West Indians | 0.0 /100 | #338 | Tragic 15.0% |
| Colville | 0.0 /100 | #339 | Tragic 15.1% |
| Chickasaw | 0.0 /100 | #340 | Tragic 15.2% |
| Choctaw | 0.0 /100 | #341 | Tragic 15.4% |
| Creek | 0.0 /100 | #342 | Tragic 15.7% |
| Lumbee | 0.0 /100 | #343 | Tragic 15.8% |
| Kiowa | 0.0 /100 | #344 | Tragic 15.8% |
| Puerto Ricans | 0.0 /100 | #345 | Tragic 16.6% |