Immigrants from Guatemala vs Dutch West Indian College, 1 year or more

COMPARE

Immigrants from Guatemala
Race
Ancestry
AfghanAfricanAlaska NativeAlaskan AthabascanAlbanianAleutAlsatianAmericanApacheArabArapahoArgentineanArmenianAssyrian/Chaldean/SyriacAustralianAustrianBahamianBangladeshiBarbadianBasqueBelgianBelizeanBermudanBhutaneseBlackfeetBolivianBrazilianBritishBritish West IndianBulgarianBurmeseCajunCambodianCanadianCape VerdeanCarpatho RusynCelticCentral AmericanCentral American IndianCherokeeCheyenneChickasawChileanChineseChippewaChoctawColombianColvilleComancheCosta RicanCreeCreekCroatianCrowCubanCypriotCzechCzechoslovakianDanishDelawareDominicanDutchEastern EuropeanEcuadorianEgyptianEnglishEstonianEthiopianEuropeanFijianFilipinoFinnishFrenchFrench American IndianFrench CanadianGermanGerman RussianGhanaianGreekGuamanian/ChamorroGuatemalanGuyaneseHaitianHmongHonduranHopiHoumaHungarianIcelanderIndian (Asian)IndonesianInupiatIranianIraqiIrishIroquoisIsraeliItalianJamaicanJapaneseJordanianKenyanKiowaKoreanLaotianLatvianLebaneseLiberianLithuanianLumbeeLuxembourgerMacedonianMalaysianMalteseMarshalleseMenomineeMexicanMexican American IndianMongolianMoroccanNative HawaiianNavajoNepaleseNew ZealanderNicaraguanNigerianNorthern EuropeanNorwegianOkinawanOsageOttawaPaiutePakistaniPalestinianPanamanianParaguayanPennsylvania GermanPeruvianPimaPolishPortuguesePotawatomiPuebloPuerto RicanPuget Sound SalishRomanianRussianSalvadoranSamoanScandinavianScotch-IrishScottishSeminoleSenegaleseSerbianShoshoneSierra LeoneanSiouxSlavicSlovakSloveneSomaliSouth AfricanSouth AmericanSouth American IndianSoviet UnionSpaniardSpanishSpanish AmericanSpanish American IndianSri LankanSubsaharan AfricanSudaneseSwedishSwissSyrianTaiwaneseThaiTlingit-HaidaTohono O'OdhamTonganTrinidadian and TobagonianTsimshianTurkishU.S. Virgin IslanderUgandanUkrainianUruguayanUteVenezuelanVietnameseWelshWest IndianYakamaYaquiYugoslavianYumanYup'ikZimbabwean
Immigration
NonimmigrantsImmigrantsAfghanistanAfricaAlbaniaArgentinaArmeniaAsiaAustraliaAustriaBahamasBangladeshBarbadosBelarusBelgiumBelizeBoliviaBosnia and HerzegovinaBrazilBulgariaBurma/MyanmarCabo VerdeCambodiaCameroonCanadaCaribbeanCentral AmericaChileChinaColombiaCongoCosta RicaCroatiaCubaCzechoslovakiaDenmarkDominicaDominican RepublicEastern AfricaEastern AsiaEastern EuropeEcuadorEgyptEl SalvadorEnglandEritreaEthiopiaEuropeFijiFranceGermanyGhanaGreeceGrenadaGuatemalaGuyanaHaitiHondurasHong KongHungaryIndiaIndonesiaIranIraqIrelandIsraelItalyJamaicaJapanJordanKazakhstanKenyaKoreaKuwaitLaosLatin AmericaLatviaLebanonLiberiaLithuaniaMalaysiaMexicoMicronesiaMiddle AfricaMoldovaMoroccoNepalNetherlandsNicaraguaNigeriaNorth AmericaNorth MacedoniaNorthern AfricaNorthern EuropeNorwayOceaniaPakistanPanamaPeruPhilippinesPolandPortugalRomaniaRussiaSaudi ArabiaScotlandSenegalSerbiaSierra LeoneSingaporeSomaliaSouth AfricaSouth AmericaSouth Central AsiaSouth Eastern AsiaSouthern EuropeSpainSri LankaSt. Vincent and the GrenadinesSudanSwedenSwitzerlandSyriaTaiwanThailandTrinidad and TobagoTurkeyUgandaUkraineUruguayUzbekistanVenezuelaVietnamWest IndiesWestern AfricaWestern AsiaWestern EuropeYemenZaireZimbabweAzores
Dutch West Indian
Race
Ancestry
AfghanAfricanAlaska NativeAlaskan AthabascanAlbanianAleutAlsatianAmericanApacheArabArapahoArgentineanArmenianAssyrian/Chaldean/SyriacAustralianAustrianBahamianBangladeshiBarbadianBasqueBelgianBelizeanBermudanBhutaneseBlackfeetBolivianBrazilianBritishBritish West IndianBulgarianBurmeseCajunCambodianCanadianCape VerdeanCarpatho RusynCelticCentral AmericanCentral American IndianCherokeeCheyenneChickasawChileanChineseChippewaChoctawColombianColvilleComancheCosta RicanCreeCreekCroatianCrowCubanCypriotCzechCzechoslovakianDanishDelawareDominicanDutchDutch West IndianEastern EuropeanEcuadorianEgyptianEnglishEstonianEthiopianEuropeanFijianFilipinoFinnishFrenchFrench American IndianFrench CanadianGermanGerman RussianGhanaianGreekGuamanian/ChamorroGuatemalanGuyaneseHaitianHmongHonduranHopiHoumaHungarianIcelanderIndian (Asian)IndonesianInupiatIranianIraqiIrishIroquoisIsraeliItalianJamaicanJapaneseJordanianKenyanKiowaKoreanLaotianLatvianLebaneseLiberianLithuanianLumbeeLuxembourgerMacedonianMalaysianMalteseMarshalleseMenomineeMexicanMexican American IndianMongolianMoroccanNative HawaiianNavajoNepaleseNew ZealanderNicaraguanNigerianNorthern EuropeanNorwegianOkinawanOsageOttawaPaiutePakistaniPalestinianPanamanianParaguayanPennsylvania GermanPeruvianPimaPolishPortuguesePotawatomiPuebloPuerto RicanPuget Sound SalishRomanianRussianSalvadoranSamoanScandinavianScotch-IrishScottishSeminoleSenegaleseSerbianShoshoneSierra LeoneanSiouxSlavicSlovakSloveneSomaliSouth AfricanSouth AmericanSouth American IndianSoviet UnionSpaniardSpanishSpanish AmericanSpanish American IndianSri LankanSubsaharan AfricanSudaneseSwedishSwissSyrianTaiwaneseThaiTlingit-HaidaTohono O'OdhamTonganTrinidadian and TobagonianTsimshianTurkishU.S. Virgin IslanderUgandanUkrainianUruguayanUteVenezuelanVietnameseWelshWest IndianYakamaYaquiYugoslavianYumanYup'ikZimbabwean
Immigration
NonimmigrantsImmigrantsAfghanistanAfricaAlbaniaArgentinaArmeniaAsiaAustraliaAustriaBahamasBangladeshBarbadosBelarusBelgiumBelizeBoliviaBosnia and HerzegovinaBrazilBulgariaBurma/MyanmarCabo VerdeCambodiaCameroonCanadaCaribbeanCentral AmericaChileChinaColombiaCongoCosta RicaCroatiaCubaCzechoslovakiaDenmarkDominicaDominican RepublicEastern AfricaEastern AsiaEastern EuropeEcuadorEgyptEl SalvadorEnglandEritreaEthiopiaEuropeFijiFranceGermanyGhanaGreeceGrenadaGuyanaHaitiHondurasHong KongHungaryIndiaIndonesiaIranIraqIrelandIsraelItalyJamaicaJapanJordanKazakhstanKenyaKoreaKuwaitLaosLatin AmericaLatviaLebanonLiberiaLithuaniaMalaysiaMexicoMicronesiaMiddle AfricaMoldovaMoroccoNepalNetherlandsNicaraguaNigeriaNorth AmericaNorth MacedoniaNorthern AfricaNorthern EuropeNorwayOceaniaPakistanPanamaPeruPhilippinesPolandPortugalRomaniaRussiaSaudi ArabiaScotlandSenegalSerbiaSierra LeoneSingaporeSomaliaSouth AfricaSouth AmericaSouth Central AsiaSouth Eastern AsiaSouthern EuropeSpainSri LankaSt. Vincent and the GrenadinesSudanSwedenSwitzerlandSyriaTaiwanThailandTrinidad and TobagoTurkeyUgandaUkraineUruguayUzbekistanVenezuelaVietnamWest IndiesWestern AfricaWestern AsiaWestern EuropeYemenZaireZimbabweAzores
College, 1 year or more
Income
Poverty
Unemployment
Labor Participation
Family Structure
Vehicle Availability
Education Level
Disability

College, 1 year or more Comparison

Immigrants from Guatemala

Dutch West Indians

Tragic
Tragic
50.7%
COLLEGE, 1 YEAR OR MORE
0.0/ 100
METRIC RATING
323rd/ 347
METRIC RANK
50.5%
COLLEGE, 1 YEAR OR MORE
0.0/ 100
METRIC RATING
328th/ 347
METRIC RANK

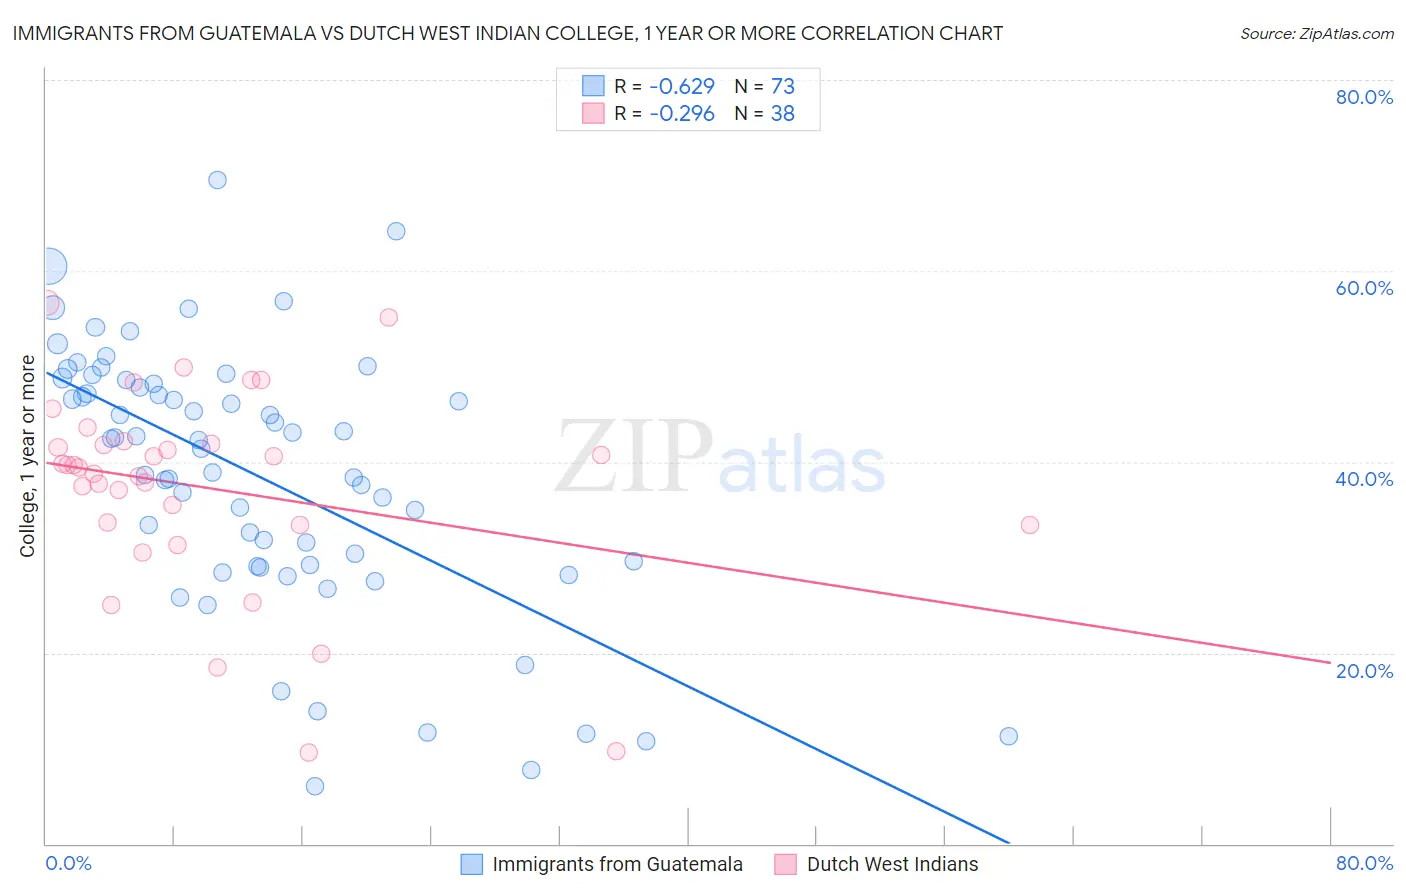
Immigrants from Guatemala vs Dutch West Indian College, 1 year or more Correlation Chart

The statistical analysis conducted on geographies consisting of 377,285,447 people shows a significant negative correlation between the proportion of Immigrants from Guatemala and percentage of population with at least college, 1 year or more education in the United States with a correlation coefficient (R) of -0.629 and weighted average of 50.7%. Similarly, the statistical analysis conducted on geographies consisting of 85,776,098 people shows a weak negative correlation between the proportion of Dutch West Indians and percentage of population with at least college, 1 year or more education in the United States with a correlation coefficient (R) of -0.296 and weighted average of 50.5%, a difference of 0.37%.
Immigrants from Guatemala vs Dutch West Indian College, 1 year or more

College, 1 year or more Correlation Summary

MeasurementImmigrants from GuatemalaDutch West Indian
Minimum6.0%9.5%
Maximum69.5%56.6%
Range63.5%47.1%
Mean38.6%37.3%
Median42.3%39.5%
Interquartile 25% (IQ1)29.2%33.3%
Interquartile 75% (IQ3)48.4%41.8%
Interquartile Range (IQR)19.2%8.5%
Standard Deviation (Sample)13.8%10.5%
Standard Deviation (Population)13.7%10.4%

Demographics Similar to Immigrants from Guatemala and Dutch West Indians by College, 1 year or more

In terms of college, 1 year or more, the demographic groups most similar to Immigrants from Guatemala are Immigrants from Cuba (50.7%, a difference of 0.010%), Immigrants from Latin America (50.7%, a difference of 0.040%), Dominican (50.6%, a difference of 0.22%), Navajo (50.8%, a difference of 0.23%), and Menominee (50.6%, a difference of 0.26%). Similarly, the demographic groups most similar to Dutch West Indians are Menominee (50.6%, a difference of 0.12%), Dominican (50.6%, a difference of 0.15%), Immigrants from Latin America (50.7%, a difference of 0.33%), Immigrants from Cuba (50.7%, a difference of 0.36%), and Cape Verdean (50.3%, a difference of 0.39%).
DemographicsRating | RankCollege, 1 year or more
Guatemalans
0.0
/100
|
#315
Tragic
51.2%
Cajuns
0.0
/100
|
#316
Tragic
51.2%
Hispanics or Latinos
0.0
/100
|
#317
Tragic
51.1%
Immigrants | Honduras
0.0
/100
|
#318
Tragic
51.0%
Immigrants | El Salvador
0.0
/100
|
#319
Tragic
51.0%
Kiowa
0.0
/100
|
#320
Tragic
51.0%
Hopi
0.0
/100
|
#321
Tragic
50.9%
Navajo
0.0
/100
|
#322
Tragic
50.8%
Immigrants | Guatemala
0.0
/100
|
#323
Tragic
50.7%
Immigrants | Cuba
0.0
/100
|
#324
Tragic
50.7%
Immigrants | Latin America
0.0
/100
|
#325
Tragic
50.7%
Dominicans
0.0
/100
|
#326
Tragic
50.6%
Menominee
0.0
/100
|
#327
Tragic
50.6%
Dutch West Indians
0.0
/100
|
#328
Tragic
50.5%
Cape Verdeans
0.0
/100
|
#329
Tragic
50.3%
Natives/Alaskans
0.0
/100
|
#330
Tragic
50.2%
Immigrants | Yemen
0.0
/100
|
#331
Tragic
50.0%
Mexicans
0.0
/100
|
#332
Tragic
49.2%
Immigrants | Dominican Republic
0.0
/100
|
#333
Tragic
49.1%
Lumbee
0.0
/100
|
#334
Tragic
48.9%
Yuman
0.0
/100
|
#335
Tragic
48.7%