Immigrants from Guatemala vs Immigrants from Jamaica Female Disability
COMPARE
Immigrants from Guatemala
Immigrants from Jamaica
Female Disability
Female Disability Comparison
Immigrants from Guatemala
Immigrants from Jamaica
12.1%
FEMALE DISABILITY
66.0/ 100
METRIC RATING
160th/ 347
METRIC RANK
12.6%
FEMALE DISABILITY
2.2/ 100
METRIC RATING
245th/ 347
METRIC RANK
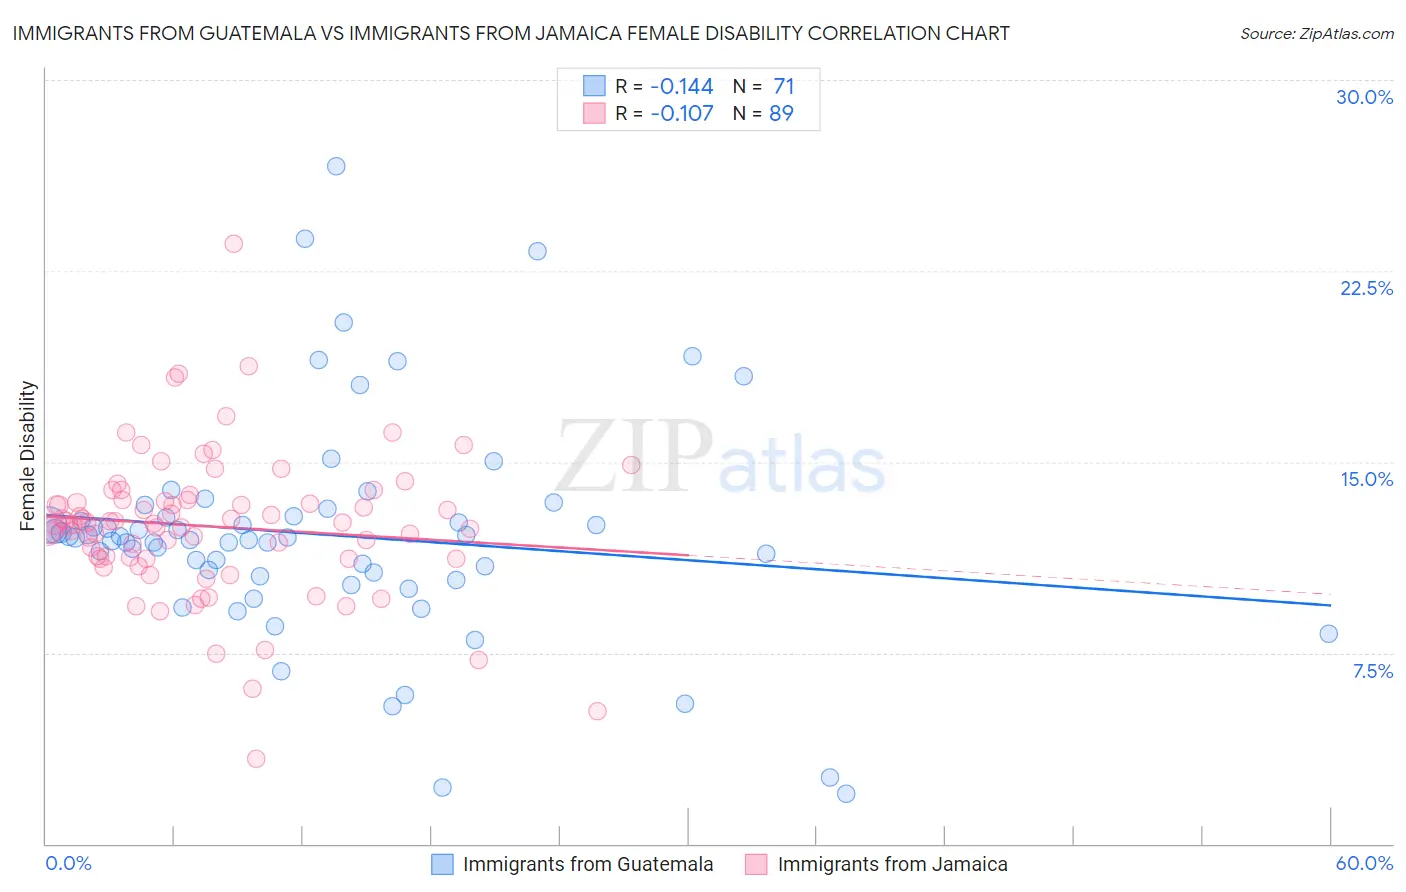
Immigrants from Guatemala vs Immigrants from Jamaica Female Disability Correlation Chart
The statistical analysis conducted on geographies consisting of 377,228,850 people shows a poor negative correlation between the proportion of Immigrants from Guatemala and percentage of females with a disability in the United States with a correlation coefficient (R) of -0.144 and weighted average of 12.1%. Similarly, the statistical analysis conducted on geographies consisting of 301,727,948 people shows a poor negative correlation between the proportion of Immigrants from Jamaica and percentage of females with a disability in the United States with a correlation coefficient (R) of -0.107 and weighted average of 12.6%, a difference of 4.2%.
Female Disability Correlation Summary
| Measurement | Immigrants from Guatemala | Immigrants from Jamaica |
| Minimum | 2.0% | 3.3% |
| Maximum | 26.6% | 23.6% |
| Range | 24.7% | 20.2% |
| Mean | 12.1% | 12.5% |
| Median | 12.0% | 12.6% |
| Interquartile 25% (IQ1) | 10.5% | 11.2% |
| Interquartile 75% (IQ3) | 12.9% | 13.5% |
| Interquartile Range (IQR) | 2.4% | 2.3% |
| Standard Deviation (Sample) | 4.4% | 2.9% |
| Standard Deviation (Population) | 4.3% | 2.8% |
Similar Demographics by Female Disability
Demographics Similar to Immigrants from Guatemala by Female Disability
In terms of female disability, the demographic groups most similar to Immigrants from Guatemala are Guyanese (12.1%, a difference of 0.060%), Immigrants from Central America (12.1%, a difference of 0.070%), Immigrants from Ukraine (12.1%, a difference of 0.070%), Guatemalan (12.1%, a difference of 0.090%), and Czech (12.1%, a difference of 0.10%).
| Demographics | Rating | Rank | Female Disability |
| Sudanese | 79.1 /100 | #153 | Good 12.0% |
| Syrians | 76.9 /100 | #154 | Good 12.1% |
| Ghanaians | 76.6 /100 | #155 | Good 12.1% |
| Moroccans | 72.9 /100 | #156 | Good 12.1% |
| Danes | 72.5 /100 | #157 | Good 12.1% |
| Immigrants | Middle Africa | 72.4 /100 | #158 | Good 12.1% |
| Immigrants | Central America | 67.7 /100 | #159 | Good 12.1% |
| Immigrants | Guatemala | 66.0 /100 | #160 | Good 12.1% |
| Guyanese | 64.7 /100 | #161 | Good 12.1% |
| Immigrants | Ukraine | 64.3 /100 | #162 | Good 12.1% |
| Guatemalans | 63.8 /100 | #163 | Good 12.1% |
| Czechs | 63.6 /100 | #164 | Good 12.1% |
| Immigrants | Oceania | 61.8 /100 | #165 | Good 12.1% |
| Lithuanians | 59.5 /100 | #166 | Average 12.2% |
| Immigrants | Latin America | 59.0 /100 | #167 | Average 12.2% |
Demographics Similar to Immigrants from Jamaica by Female Disability
In terms of female disability, the demographic groups most similar to Immigrants from Jamaica are Spanish American Indian (12.6%, a difference of 0.020%), Menominee (12.6%, a difference of 0.030%), Carpatho Rusyn (12.6%, a difference of 0.070%), Alsatian (12.6%, a difference of 0.14%), and Immigrants from Senegal (12.6%, a difference of 0.15%).
| Demographics | Rating | Rank | Female Disability |
| Yugoslavians | 3.7 /100 | #238 | Tragic 12.6% |
| Barbadians | 3.6 /100 | #239 | Tragic 12.6% |
| German Russians | 3.2 /100 | #240 | Tragic 12.6% |
| Japanese | 2.7 /100 | #241 | Tragic 12.6% |
| Canadians | 2.6 /100 | #242 | Tragic 12.6% |
| Immigrants | Senegal | 2.5 /100 | #243 | Tragic 12.6% |
| Alsatians | 2.5 /100 | #244 | Tragic 12.6% |
| Immigrants | Jamaica | 2.2 /100 | #245 | Tragic 12.6% |
| Spanish American Indians | 2.1 /100 | #246 | Tragic 12.6% |
| Menominee | 2.1 /100 | #247 | Tragic 12.6% |
| Carpatho Rusyns | 2.0 /100 | #248 | Tragic 12.6% |
| Immigrants | Congo | 1.8 /100 | #249 | Tragic 12.7% |
| Slovenes | 1.7 /100 | #250 | Tragic 12.7% |
| Crow | 1.6 /100 | #251 | Tragic 12.7% |
| Immigrants | Caribbean | 1.4 /100 | #252 | Tragic 12.7% |