Immigrants from Grenada vs West Indian Self-Care Disability
COMPARE
Immigrants from Grenada
West Indian
Self-Care Disability
Self-Care Disability Comparison
Immigrants from Grenada
West Indians
2.8%
SELF-CARE DISABILITY
0.0/ 100
METRIC RATING
308th/ 347
METRIC RANK
2.8%
SELF-CARE DISABILITY
0.0/ 100
METRIC RATING
297th/ 347
METRIC RANK
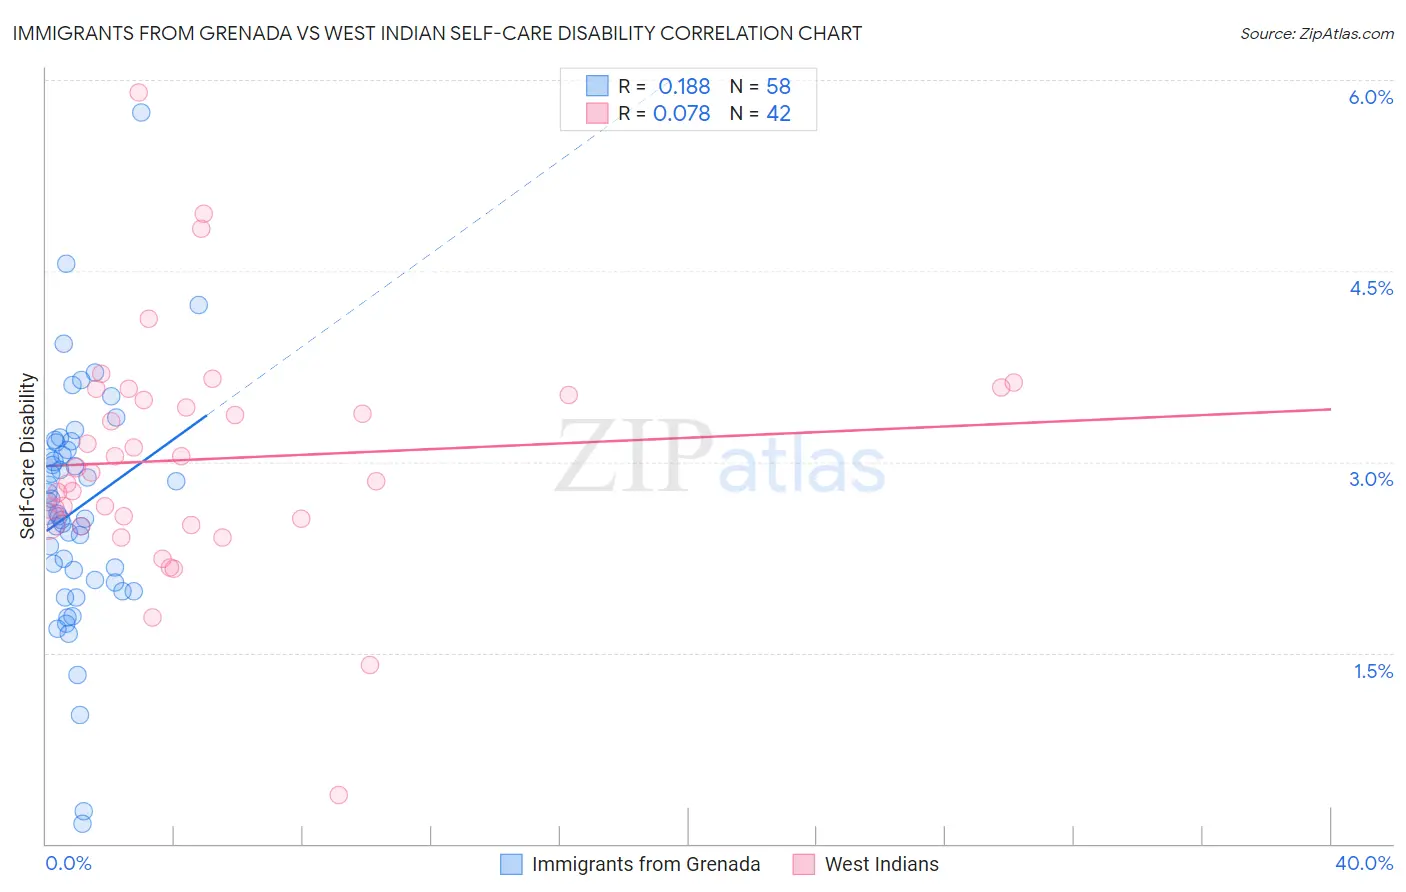
Immigrants from Grenada vs West Indian Self-Care Disability Correlation Chart
The statistical analysis conducted on geographies consisting of 67,173,864 people shows a poor positive correlation between the proportion of Immigrants from Grenada and percentage of population with self-care disability in the United States with a correlation coefficient (R) of 0.188 and weighted average of 2.8%. Similarly, the statistical analysis conducted on geographies consisting of 253,805,677 people shows a slight positive correlation between the proportion of West Indians and percentage of population with self-care disability in the United States with a correlation coefficient (R) of 0.078 and weighted average of 2.8%, a difference of 1.9%.
Self-Care Disability Correlation Summary
| Measurement | Immigrants from Grenada | West Indian |
| Minimum | 0.16% | 0.38% |
| Maximum | 5.7% | 5.9% |
| Range | 5.6% | 5.5% |
| Mean | 2.6% | 3.0% |
| Median | 2.6% | 2.9% |
| Interquartile 25% (IQ1) | 2.1% | 2.5% |
| Interquartile 75% (IQ3) | 3.1% | 3.5% |
| Interquartile Range (IQR) | 1.0% | 1.00% |
| Standard Deviation (Sample) | 0.92% | 0.93% |
| Standard Deviation (Population) | 0.92% | 0.92% |
Demographics Similar to Immigrants from Grenada and West Indians by Self-Care Disability
In terms of self-care disability, the demographic groups most similar to Immigrants from Grenada are Bangladeshi (2.8%, a difference of 0.15%), British West Indian (2.8%, a difference of 0.25%), Native/Alaskan (2.8%, a difference of 0.30%), Puget Sound Salish (2.8%, a difference of 0.32%), and Aleut (2.8%, a difference of 0.37%). Similarly, the demographic groups most similar to West Indians are Immigrants from Portugal (2.8%, a difference of 0.090%), American (2.8%, a difference of 0.12%), Immigrants from Guyana (2.8%, a difference of 0.21%), Barbadian (2.7%, a difference of 0.51%), and Central American Indian (2.7%, a difference of 0.66%).
| Demographics | Rating | Rank | Self-Care Disability |
| Central American Indians | 0.0 /100 | #292 | Tragic 2.7% |
| Belizeans | 0.0 /100 | #293 | Tragic 2.7% |
| Blackfeet | 0.0 /100 | #294 | Tragic 2.7% |
| Barbadians | 0.0 /100 | #295 | Tragic 2.7% |
| Immigrants | Portugal | 0.0 /100 | #296 | Tragic 2.8% |
| West Indians | 0.0 /100 | #297 | Tragic 2.8% |
| Americans | 0.0 /100 | #298 | Tragic 2.8% |
| Immigrants | Guyana | 0.0 /100 | #299 | Tragic 2.8% |
| Immigrants | Fiji | 0.0 /100 | #300 | Tragic 2.8% |
| Pima | 0.0 /100 | #301 | Tragic 2.8% |
| Immigrants | St. Vincent and the Grenadines | 0.0 /100 | #302 | Tragic 2.8% |
| Immigrants | Belize | 0.0 /100 | #303 | Tragic 2.8% |
| Cree | 0.0 /100 | #304 | Tragic 2.8% |
| Immigrants | West Indies | 0.0 /100 | #305 | Tragic 2.8% |
| Aleuts | 0.0 /100 | #306 | Tragic 2.8% |
| Natives/Alaskans | 0.0 /100 | #307 | Tragic 2.8% |
| Immigrants | Grenada | 0.0 /100 | #308 | Tragic 2.8% |
| Bangladeshis | 0.0 /100 | #309 | Tragic 2.8% |
| British West Indians | 0.0 /100 | #310 | Tragic 2.8% |
| Puget Sound Salish | 0.0 /100 | #311 | Tragic 2.8% |
| Immigrants | Caribbean | 0.0 /100 | #312 | Tragic 2.8% |