Immigrants from Grenada vs Immigrants from Sri Lanka Self-Care Disability
COMPARE
Immigrants from Grenada
Immigrants from Sri Lanka
Self-Care Disability
Self-Care Disability Comparison
Immigrants from Grenada
Immigrants from Sri Lanka
2.8%
SELF-CARE DISABILITY
0.0/ 100
METRIC RATING
308th/ 347
METRIC RANK
2.2%
SELF-CARE DISABILITY
99.9/ 100
METRIC RATING
26th/ 347
METRIC RANK
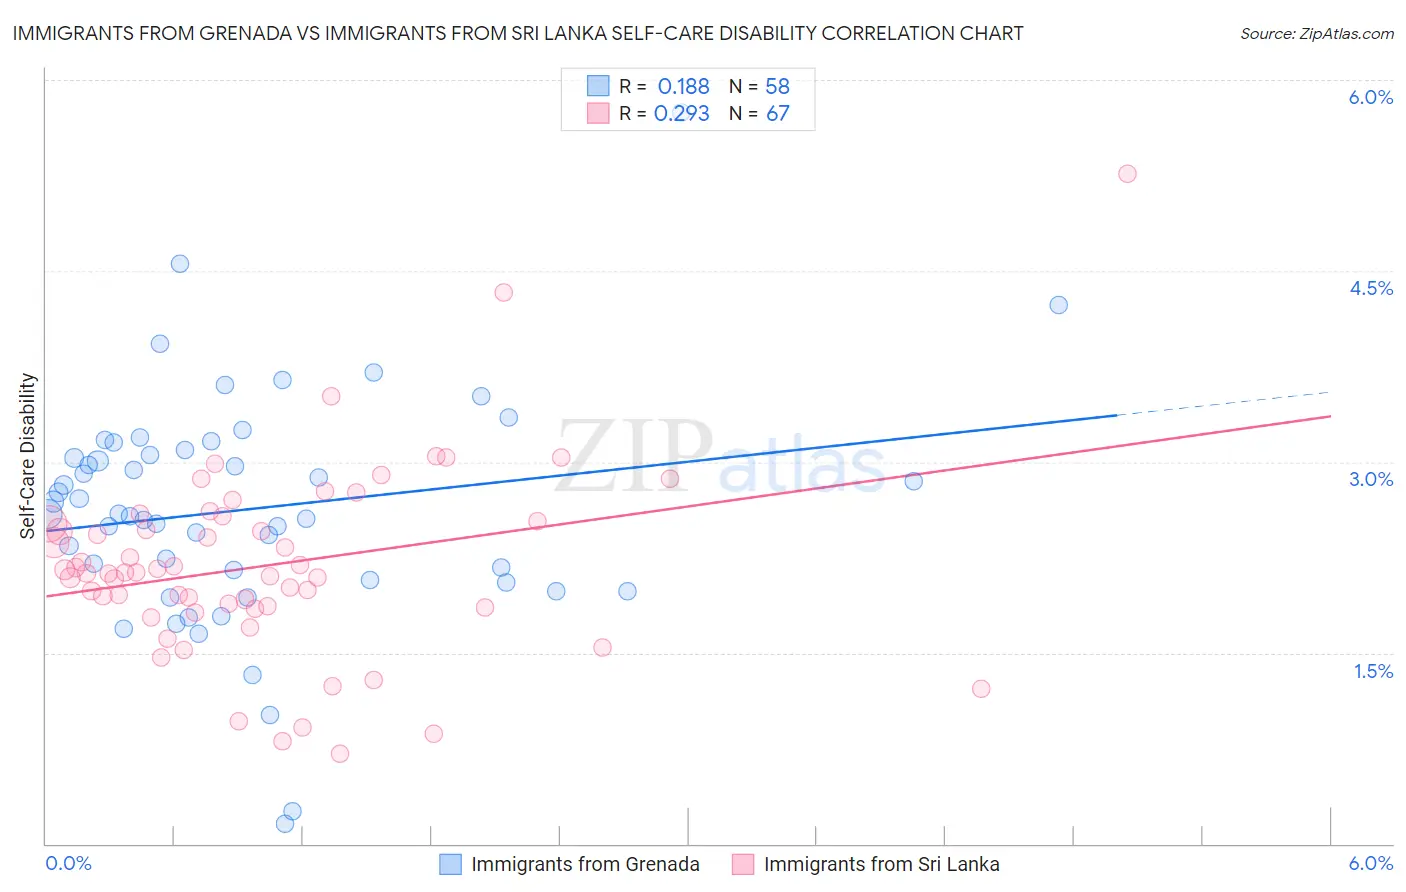
Immigrants from Grenada vs Immigrants from Sri Lanka Self-Care Disability Correlation Chart
The statistical analysis conducted on geographies consisting of 67,173,864 people shows a poor positive correlation between the proportion of Immigrants from Grenada and percentage of population with self-care disability in the United States with a correlation coefficient (R) of 0.188 and weighted average of 2.8%. Similarly, the statistical analysis conducted on geographies consisting of 149,648,116 people shows a weak positive correlation between the proportion of Immigrants from Sri Lanka and percentage of population with self-care disability in the United States with a correlation coefficient (R) of 0.293 and weighted average of 2.2%, a difference of 25.4%.
Self-Care Disability Correlation Summary
| Measurement | Immigrants from Grenada | Immigrants from Sri Lanka |
| Minimum | 0.16% | 0.71% |
| Maximum | 5.7% | 5.3% |
| Range | 5.6% | 4.6% |
| Mean | 2.6% | 2.2% |
| Median | 2.6% | 2.1% |
| Interquartile 25% (IQ1) | 2.1% | 1.9% |
| Interquartile 75% (IQ3) | 3.1% | 2.5% |
| Interquartile Range (IQR) | 1.0% | 0.68% |
| Standard Deviation (Sample) | 0.92% | 0.75% |
| Standard Deviation (Population) | 0.92% | 0.74% |
Similar Demographics by Self-Care Disability
Demographics Similar to Immigrants from Grenada by Self-Care Disability
In terms of self-care disability, the demographic groups most similar to Immigrants from Grenada are Bangladeshi (2.8%, a difference of 0.15%), British West Indian (2.8%, a difference of 0.25%), Native/Alaskan (2.8%, a difference of 0.30%), Puget Sound Salish (2.8%, a difference of 0.32%), and Aleut (2.8%, a difference of 0.37%).
| Demographics | Rating | Rank | Self-Care Disability |
| Pima | 0.0 /100 | #301 | Tragic 2.8% |
| Immigrants | St. Vincent and the Grenadines | 0.0 /100 | #302 | Tragic 2.8% |
| Immigrants | Belize | 0.0 /100 | #303 | Tragic 2.8% |
| Cree | 0.0 /100 | #304 | Tragic 2.8% |
| Immigrants | West Indies | 0.0 /100 | #305 | Tragic 2.8% |
| Aleuts | 0.0 /100 | #306 | Tragic 2.8% |
| Natives/Alaskans | 0.0 /100 | #307 | Tragic 2.8% |
| Immigrants | Grenada | 0.0 /100 | #308 | Tragic 2.8% |
| Bangladeshis | 0.0 /100 | #309 | Tragic 2.8% |
| British West Indians | 0.0 /100 | #310 | Tragic 2.8% |
| Puget Sound Salish | 0.0 /100 | #311 | Tragic 2.8% |
| Immigrants | Caribbean | 0.0 /100 | #312 | Tragic 2.8% |
| Spanish Americans | 0.0 /100 | #313 | Tragic 2.8% |
| Creek | 0.0 /100 | #314 | Tragic 2.8% |
| Immigrants | Cuba | 0.0 /100 | #315 | Tragic 2.8% |
Demographics Similar to Immigrants from Sri Lanka by Self-Care Disability
In terms of self-care disability, the demographic groups most similar to Immigrants from Sri Lanka are Venezuelan (2.2%, a difference of 0.010%), Turkish (2.2%, a difference of 0.070%), Inupiat (2.2%, a difference of 0.17%), Cypriot (2.2%, a difference of 0.18%), and Immigrants from Zimbabwe (2.3%, a difference of 0.26%).
| Demographics | Rating | Rank | Self-Care Disability |
| Immigrants | Eritrea | 100.0 /100 | #19 | Exceptional 2.2% |
| Tongans | 100.0 /100 | #20 | Exceptional 2.2% |
| Bulgarians | 100.0 /100 | #21 | Exceptional 2.2% |
| Immigrants | Venezuela | 100.0 /100 | #22 | Exceptional 2.2% |
| Cambodians | 100.0 /100 | #23 | Exceptional 2.2% |
| Cypriots | 100.0 /100 | #24 | Exceptional 2.2% |
| Turks | 100.0 /100 | #25 | Exceptional 2.2% |
| Immigrants | Sri Lanka | 99.9 /100 | #26 | Exceptional 2.2% |
| Venezuelans | 99.9 /100 | #27 | Exceptional 2.2% |
| Inupiat | 99.9 /100 | #28 | Exceptional 2.2% |
| Immigrants | Zimbabwe | 99.9 /100 | #29 | Exceptional 2.3% |
| Paraguayans | 99.9 /100 | #30 | Exceptional 2.3% |
| Danes | 99.9 /100 | #31 | Exceptional 2.3% |
| Burmese | 99.9 /100 | #32 | Exceptional 2.3% |
| Immigrants | Korea | 99.9 /100 | #33 | Exceptional 2.3% |