Dutch West Indian vs Vietnamese Self-Care Disability
COMPARE
Dutch West Indian
Vietnamese
Self-Care Disability
Self-Care Disability Comparison
Dutch West Indians
Vietnamese
3.0%
SELF-CARE DISABILITY
0.0/ 100
METRIC RATING
333rd/ 347
METRIC RANK
2.6%
SELF-CARE DISABILITY
2.1/ 100
METRIC RATING
234th/ 347
METRIC RANK
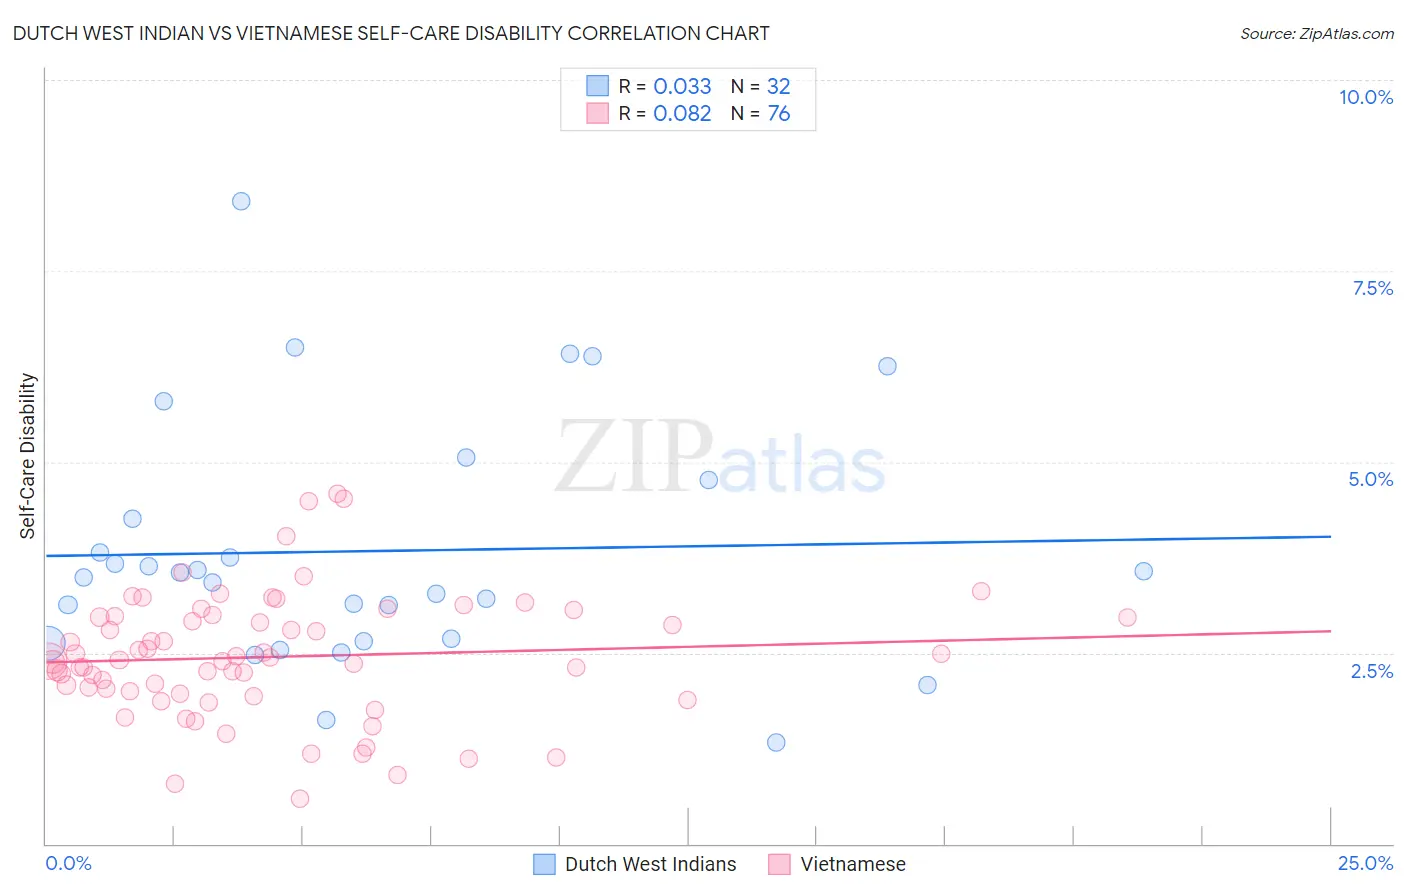
Dutch West Indian vs Vietnamese Self-Care Disability Correlation Chart
The statistical analysis conducted on geographies consisting of 85,744,366 people shows no correlation between the proportion of Dutch West Indians and percentage of population with self-care disability in the United States with a correlation coefficient (R) of 0.033 and weighted average of 3.0%. Similarly, the statistical analysis conducted on geographies consisting of 170,626,473 people shows a slight positive correlation between the proportion of Vietnamese and percentage of population with self-care disability in the United States with a correlation coefficient (R) of 0.082 and weighted average of 2.6%, a difference of 15.7%.
Self-Care Disability Correlation Summary
| Measurement | Dutch West Indian | Vietnamese |
| Minimum | 1.3% | 0.58% |
| Maximum | 8.4% | 4.6% |
| Range | 7.1% | 4.0% |
| Mean | 3.8% | 2.4% |
| Median | 3.5% | 2.4% |
| Interquartile 25% (IQ1) | 2.7% | 2.0% |
| Interquartile 75% (IQ3) | 4.5% | 3.0% |
| Interquartile Range (IQR) | 1.8% | 0.99% |
| Standard Deviation (Sample) | 1.6% | 0.82% |
| Standard Deviation (Population) | 1.6% | 0.81% |
Similar Demographics by Self-Care Disability
Demographics Similar to Dutch West Indians by Self-Care Disability
In terms of self-care disability, the demographic groups most similar to Dutch West Indians are Houma (3.0%, a difference of 0.070%), Immigrants from the Azores (3.0%, a difference of 0.12%), Kiowa (3.0%, a difference of 0.23%), Immigrants from Yemen (3.0%, a difference of 0.28%), and Lumbee (3.0%, a difference of 0.59%).
| Demographics | Rating | Rank | Self-Care Disability |
| Paiute | 0.0 /100 | #326 | Tragic 2.9% |
| Blacks/African Americans | 0.0 /100 | #327 | Tragic 2.9% |
| Hopi | 0.0 /100 | #328 | Tragic 2.9% |
| Cajuns | 0.0 /100 | #329 | Tragic 2.9% |
| Nepalese | 0.0 /100 | #330 | Tragic 3.0% |
| Lumbee | 0.0 /100 | #331 | Tragic 3.0% |
| Kiowa | 0.0 /100 | #332 | Tragic 3.0% |
| Dutch West Indians | 0.0 /100 | #333 | Tragic 3.0% |
| Houma | 0.0 /100 | #334 | Tragic 3.0% |
| Immigrants | Azores | 0.0 /100 | #335 | Tragic 3.0% |
| Immigrants | Yemen | 0.0 /100 | #336 | Tragic 3.0% |
| Choctaw | 0.0 /100 | #337 | Tragic 3.0% |
| Cape Verdeans | 0.0 /100 | #338 | Tragic 3.0% |
| Immigrants | Dominican Republic | 0.0 /100 | #339 | Tragic 3.0% |
| Immigrants | Cabo Verde | 0.0 /100 | #340 | Tragic 3.1% |
Demographics Similar to Vietnamese by Self-Care Disability
In terms of self-care disability, the demographic groups most similar to Vietnamese are Liberian (2.6%, a difference of 0.010%), Bahamian (2.6%, a difference of 0.040%), Albanian (2.6%, a difference of 0.050%), Immigrants from Guatemala (2.6%, a difference of 0.070%), and Bermudan (2.6%, a difference of 0.10%).
| Demographics | Rating | Rank | Self-Care Disability |
| Immigrants | Philippines | 2.7 /100 | #227 | Tragic 2.6% |
| Guatemalans | 2.7 /100 | #228 | Tragic 2.6% |
| Guamanians/Chamorros | 2.5 /100 | #229 | Tragic 2.6% |
| Immigrants | Ecuador | 2.5 /100 | #230 | Tragic 2.6% |
| Immigrants | Guatemala | 2.2 /100 | #231 | Tragic 2.6% |
| Albanians | 2.2 /100 | #232 | Tragic 2.6% |
| Liberians | 2.1 /100 | #233 | Tragic 2.6% |
| Vietnamese | 2.1 /100 | #234 | Tragic 2.6% |
| Bahamians | 2.0 /100 | #235 | Tragic 2.6% |
| Bermudans | 1.9 /100 | #236 | Tragic 2.6% |
| Immigrants | Senegal | 1.6 /100 | #237 | Tragic 2.6% |
| Senegalese | 1.3 /100 | #238 | Tragic 2.6% |
| Immigrants | Panama | 1.2 /100 | #239 | Tragic 2.6% |
| Marshallese | 1.2 /100 | #240 | Tragic 2.6% |
| Immigrants | Syria | 1.0 /100 | #241 | Tragic 2.6% |