Immigrants from Greece vs Vietnamese Child Poverty Among Girls Under 16
COMPARE
Immigrants from Greece
Vietnamese
Child Poverty Among Girls Under 16
Child Poverty Among Girls Under 16 Comparison
Immigrants from Greece
Vietnamese
14.1%
CHILD POVERTY AMONG GIRLS UNDER 16
99.3/ 100
METRIC RATING
45th/ 347
METRIC RANK
19.5%
CHILD POVERTY AMONG GIRLS UNDER 16
0.2/ 100
METRIC RATING
261st/ 347
METRIC RANK
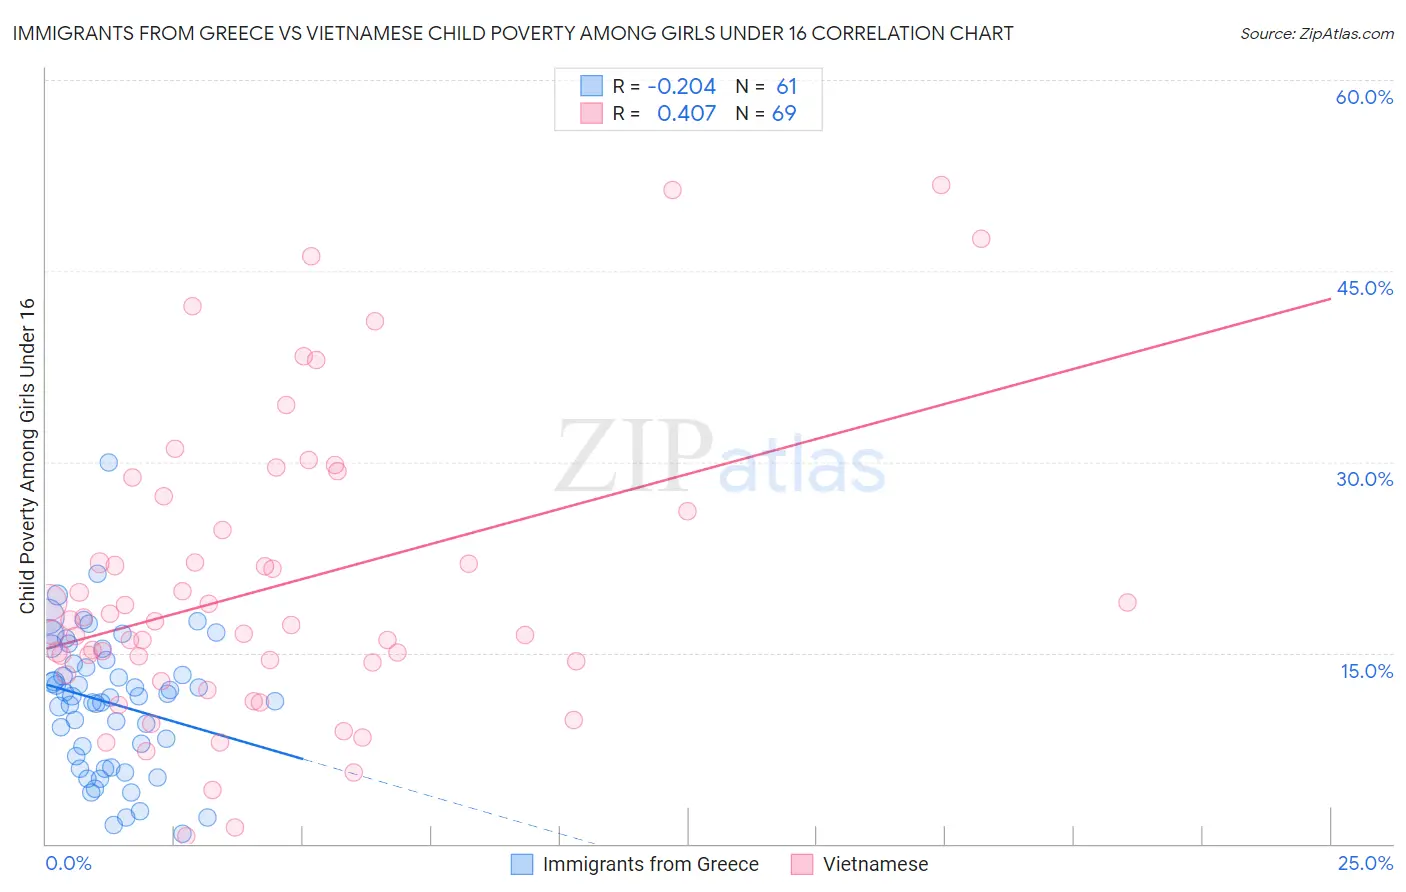
Immigrants from Greece vs Vietnamese Child Poverty Among Girls Under 16 Correlation Chart
The statistical analysis conducted on geographies consisting of 213,202,759 people shows a weak negative correlation between the proportion of Immigrants from Greece and poverty level among girls under the age of 16 in the United States with a correlation coefficient (R) of -0.204 and weighted average of 14.1%. Similarly, the statistical analysis conducted on geographies consisting of 169,480,173 people shows a moderate positive correlation between the proportion of Vietnamese and poverty level among girls under the age of 16 in the United States with a correlation coefficient (R) of 0.407 and weighted average of 19.5%, a difference of 38.1%.
Child Poverty Among Girls Under 16 Correlation Summary
| Measurement | Immigrants from Greece | Vietnamese |
| Minimum | 0.79% | 0.61% |
| Maximum | 29.9% | 51.8% |
| Range | 29.1% | 51.2% |
| Mean | 11.1% | 20.1% |
| Median | 11.6% | 17.1% |
| Interquartile 25% (IQ1) | 6.4% | 13.8% |
| Interquartile 75% (IQ3) | 14.3% | 25.3% |
| Interquartile Range (IQR) | 7.9% | 11.6% |
| Standard Deviation (Sample) | 5.4% | 11.4% |
| Standard Deviation (Population) | 5.4% | 11.3% |
Similar Demographics by Child Poverty Among Girls Under 16
Demographics Similar to Immigrants from Greece by Child Poverty Among Girls Under 16
In terms of child poverty among girls under 16, the demographic groups most similar to Immigrants from Greece are Croatian (14.1%, a difference of 0.030%), Immigrants from Czechoslovakia (14.2%, a difference of 0.060%), Czech (14.2%, a difference of 0.070%), Greek (14.2%, a difference of 0.11%), and Immigrants from Israel (14.2%, a difference of 0.18%).
| Demographics | Rating | Rank | Child Poverty Among Girls Under 16 |
| Immigrants | Moldova | 99.6 /100 | #38 | Exceptional 13.9% |
| Immigrants | Australia | 99.5 /100 | #39 | Exceptional 14.0% |
| Immigrants | Sri Lanka | 99.5 /100 | #40 | Exceptional 14.0% |
| Immigrants | Bolivia | 99.5 /100 | #41 | Exceptional 14.0% |
| Immigrants | Scotland | 99.4 /100 | #42 | Exceptional 14.0% |
| Koreans | 99.4 /100 | #43 | Exceptional 14.1% |
| Immigrants | Asia | 99.4 /100 | #44 | Exceptional 14.1% |
| Immigrants | Greece | 99.3 /100 | #45 | Exceptional 14.1% |
| Croatians | 99.3 /100 | #46 | Exceptional 14.1% |
| Immigrants | Czechoslovakia | 99.3 /100 | #47 | Exceptional 14.2% |
| Czechs | 99.3 /100 | #48 | Exceptional 14.2% |
| Greeks | 99.2 /100 | #49 | Exceptional 14.2% |
| Immigrants | Israel | 99.2 /100 | #50 | Exceptional 14.2% |
| Immigrants | Pakistan | 99.1 /100 | #51 | Exceptional 14.2% |
| Italians | 99.1 /100 | #52 | Exceptional 14.3% |
Demographics Similar to Vietnamese by Child Poverty Among Girls Under 16
In terms of child poverty among girls under 16, the demographic groups most similar to Vietnamese are Mexican American Indian (19.5%, a difference of 0.090%), Chickasaw (19.6%, a difference of 0.52%), Immigrants from Burma/Myanmar (19.7%, a difference of 0.64%), Ottawa (19.4%, a difference of 0.67%), and Jamaican (19.7%, a difference of 0.76%).
| Demographics | Rating | Rank | Child Poverty Among Girls Under 16 |
| Immigrants | Western Africa | 0.3 /100 | #254 | Tragic 19.3% |
| Immigrants | Ecuador | 0.3 /100 | #255 | Tragic 19.3% |
| Trinidadians and Tobagonians | 0.2 /100 | #256 | Tragic 19.3% |
| Guyanese | 0.2 /100 | #257 | Tragic 19.4% |
| Salvadorans | 0.2 /100 | #258 | Tragic 19.4% |
| Ottawa | 0.2 /100 | #259 | Tragic 19.4% |
| Mexican American Indians | 0.2 /100 | #260 | Tragic 19.5% |
| Vietnamese | 0.2 /100 | #261 | Tragic 19.5% |
| Chickasaw | 0.1 /100 | #262 | Tragic 19.6% |
| Immigrants | Burma/Myanmar | 0.1 /100 | #263 | Tragic 19.7% |
| Jamaicans | 0.1 /100 | #264 | Tragic 19.7% |
| Immigrants | Jamaica | 0.1 /100 | #265 | Tragic 19.8% |
| Spanish Americans | 0.1 /100 | #266 | Tragic 19.8% |
| Immigrants | Bangladesh | 0.1 /100 | #267 | Tragic 19.9% |
| Spanish American Indians | 0.1 /100 | #268 | Tragic 19.9% |