Immigrants from Greece vs Immigrants from Uganda Disability Age 5 to 17

COMPARE

Immigrants from Greece
Race
Ancestry
AfghanAfricanAlaska NativeAlaskan AthabascanAlbanianAleutAlsatianAmericanApacheArabArapahoArgentineanArmenianAssyrian/Chaldean/SyriacAustralianAustrianBahamianBangladeshiBarbadianBasqueBelgianBelizeanBermudanBhutaneseBlackfeetBolivianBrazilianBritishBritish West IndianBulgarianBurmeseCajunCambodianCanadianCape VerdeanCarpatho RusynCelticCentral AmericanCentral American IndianCherokeeCheyenneChickasawChileanChineseChippewaChoctawColombianColvilleComancheCosta RicanCreeCreekCroatianCrowCubanCypriotCzechCzechoslovakianDanishDelawareDominicanDutchDutch West IndianEastern EuropeanEcuadorianEgyptianEnglishEstonianEthiopianEuropeanFijianFilipinoFinnishFrenchFrench American IndianFrench CanadianGermanGerman RussianGhanaianGreekGuamanian/ChamorroGuatemalanGuyaneseHaitianHmongHonduranHopiHoumaHungarianIcelanderIndian (Asian)IndonesianInupiatIranianIraqiIrishIroquoisIsraeliItalianJamaicanJapaneseJordanianKenyanKiowaKoreanLaotianLatvianLebaneseLiberianLithuanianLumbeeLuxembourgerMacedonianMalaysianMalteseMarshalleseMenomineeMexicanMexican American IndianMongolianMoroccanNative HawaiianNavajoNepaleseNew ZealanderNicaraguanNigerianNorthern EuropeanNorwegianOkinawanOsageOttawaPaiutePakistaniPalestinianPanamanianParaguayanPennsylvania GermanPeruvianPimaPolishPortuguesePotawatomiPuebloPuerto RicanPuget Sound SalishRomanianRussianSalvadoranSamoanScandinavianScotch-IrishScottishSeminoleSenegaleseSerbianShoshoneSierra LeoneanSiouxSlavicSlovakSloveneSomaliSouth AfricanSouth AmericanSouth American IndianSoviet UnionSpaniardSpanishSpanish AmericanSpanish American IndianSri LankanSubsaharan AfricanSudaneseSwedishSwissSyrianTaiwaneseThaiTlingit-HaidaTohono O'OdhamTonganTrinidadian and TobagonianTsimshianTurkishU.S. Virgin IslanderUgandanUkrainianUruguayanUteVenezuelanVietnameseWelshWest IndianYakamaYaquiYugoslavianYumanYup'ikZimbabwean
Immigration
NonimmigrantsImmigrantsAfghanistanAfricaAlbaniaArgentinaArmeniaAsiaAustraliaAustriaBahamasBangladeshBarbadosBelarusBelgiumBelizeBoliviaBosnia and HerzegovinaBrazilBulgariaBurma/MyanmarCabo VerdeCambodiaCameroonCanadaCaribbeanCentral AmericaChileChinaColombiaCongoCosta RicaCroatiaCubaCzechoslovakiaDenmarkDominicaDominican RepublicEastern AfricaEastern AsiaEastern EuropeEcuadorEgyptEl SalvadorEnglandEritreaEthiopiaEuropeFijiFranceGermanyGhanaGreeceGrenadaGuatemalaGuyanaHaitiHondurasHong KongHungaryIndiaIndonesiaIranIraqIrelandIsraelItalyJamaicaJapanJordanKazakhstanKenyaKoreaKuwaitLaosLatin AmericaLatviaLebanonLiberiaLithuaniaMalaysiaMexicoMicronesiaMiddle AfricaMoldovaMoroccoNepalNetherlandsNicaraguaNigeriaNorth AmericaNorth MacedoniaNorthern AfricaNorthern EuropeNorwayOceaniaPakistanPanamaPeruPhilippinesPolandPortugalRomaniaRussiaSaudi ArabiaScotlandSenegalSerbiaSierra LeoneSingaporeSomaliaSouth AfricaSouth AmericaSouth Central AsiaSouth Eastern AsiaSouthern EuropeSpainSri LankaSt. Vincent and the GrenadinesSudanSwedenSwitzerlandSyriaTaiwanThailandTrinidad and TobagoTurkeyUkraineUruguayUzbekistanVenezuelaVietnamWest IndiesWestern AfricaWestern AsiaWestern EuropeYemenZaireZimbabweAzores
Immigrants from Uganda
Race
Ancestry
AfghanAfricanAlaska NativeAlaskan AthabascanAlbanianAleutAlsatianAmericanApacheArabArapahoArgentineanArmenianAssyrian/Chaldean/SyriacAustralianAustrianBahamianBangladeshiBarbadianBasqueBelgianBelizeanBermudanBhutaneseBlackfeetBolivianBrazilianBritishBritish West IndianBulgarianBurmeseCajunCambodianCanadianCape VerdeanCarpatho RusynCelticCentral AmericanCentral American IndianCherokeeCheyenneChickasawChileanChineseChippewaChoctawColombianColvilleComancheCosta RicanCreeCreekCroatianCrowCubanCypriotCzechCzechoslovakianDanishDelawareDominicanDutchDutch West IndianEastern EuropeanEcuadorianEgyptianEnglishEstonianEthiopianEuropeanFijianFilipinoFinnishFrenchFrench American IndianFrench CanadianGermanGerman RussianGhanaianGreekGuamanian/ChamorroGuatemalanGuyaneseHaitianHmongHonduranHopiHoumaHungarianIcelanderIndian (Asian)IndonesianInupiatIranianIraqiIrishIroquoisIsraeliItalianJamaicanJapaneseJordanianKenyanKiowaKoreanLaotianLatvianLebaneseLiberianLithuanianLumbeeLuxembourgerMacedonianMalaysianMalteseMarshalleseMenomineeMexicanMexican American IndianMongolianMoroccanNative HawaiianNavajoNepaleseNew ZealanderNicaraguanNigerianNorthern EuropeanNorwegianOkinawanOsageOttawaPaiutePakistaniPalestinianPanamanianParaguayanPennsylvania GermanPeruvianPimaPolishPortuguesePotawatomiPuebloPuerto RicanPuget Sound SalishRomanianRussianSalvadoranSamoanScandinavianScotch-IrishScottishSeminoleSenegaleseSerbianShoshoneSierra LeoneanSiouxSlavicSlovakSloveneSomaliSouth AfricanSouth AmericanSouth American IndianSoviet UnionSpaniardSpanishSpanish AmericanSpanish American IndianSri LankanSubsaharan AfricanSudaneseSwedishSwissSyrianTaiwaneseThaiTlingit-HaidaTohono O'OdhamTonganTrinidadian and TobagonianTsimshianTurkishU.S. Virgin IslanderUgandanUkrainianUruguayanUteVenezuelanVietnameseWelshWest IndianYakamaYaquiYugoslavianYumanYup'ikZimbabwean
Immigration
NonimmigrantsImmigrantsAfghanistanAfricaAlbaniaArgentinaArmeniaAsiaAustraliaAustriaBahamasBangladeshBarbadosBelarusBelgiumBelizeBoliviaBosnia and HerzegovinaBrazilBulgariaBurma/MyanmarCabo VerdeCambodiaCameroonCanadaCaribbeanCentral AmericaChileChinaColombiaCongoCosta RicaCroatiaCubaCzechoslovakiaDenmarkDominicaDominican RepublicEastern AfricaEastern AsiaEastern EuropeEcuadorEgyptEl SalvadorEnglandEritreaEthiopiaEuropeFijiFranceGermanyGhanaGrenadaGuatemalaGuyanaHaitiHondurasHong KongHungaryIndiaIndonesiaIranIraqIrelandIsraelItalyJamaicaJapanJordanKazakhstanKenyaKoreaKuwaitLaosLatin AmericaLatviaLebanonLiberiaLithuaniaMalaysiaMexicoMicronesiaMiddle AfricaMoldovaMoroccoNepalNetherlandsNicaraguaNigeriaNorth AmericaNorth MacedoniaNorthern AfricaNorthern EuropeNorwayOceaniaPakistanPanamaPeruPhilippinesPolandPortugalRomaniaRussiaSaudi ArabiaScotlandSenegalSerbiaSierra LeoneSingaporeSomaliaSouth AfricaSouth AmericaSouth Central AsiaSouth Eastern AsiaSouthern EuropeSpainSri LankaSt. Vincent and the GrenadinesSudanSwedenSwitzerlandSyriaTaiwanThailandTrinidad and TobagoTurkeyUgandaUkraineUruguayUzbekistanVenezuelaVietnamWest IndiesWestern AfricaWestern AsiaWestern EuropeYemenZaireZimbabweAzores
Disability Age 5 to 17
Income
Poverty
Unemployment
Labor Participation
Family Structure
Vehicle Availability
Education Level
Disability

Disability Age 5 to 17 Comparison

Immigrants from Greece

Immigrants from Uganda

Exceptional
Tragic
5.2%
DISABILITY AGE 5 TO 17
99.8/ 100
METRIC RATING
65th/ 347
METRIC RANK
5.8%
DISABILITY AGE 5 TO 17
9.7/ 100
METRIC RATING
209th/ 347
METRIC RANK

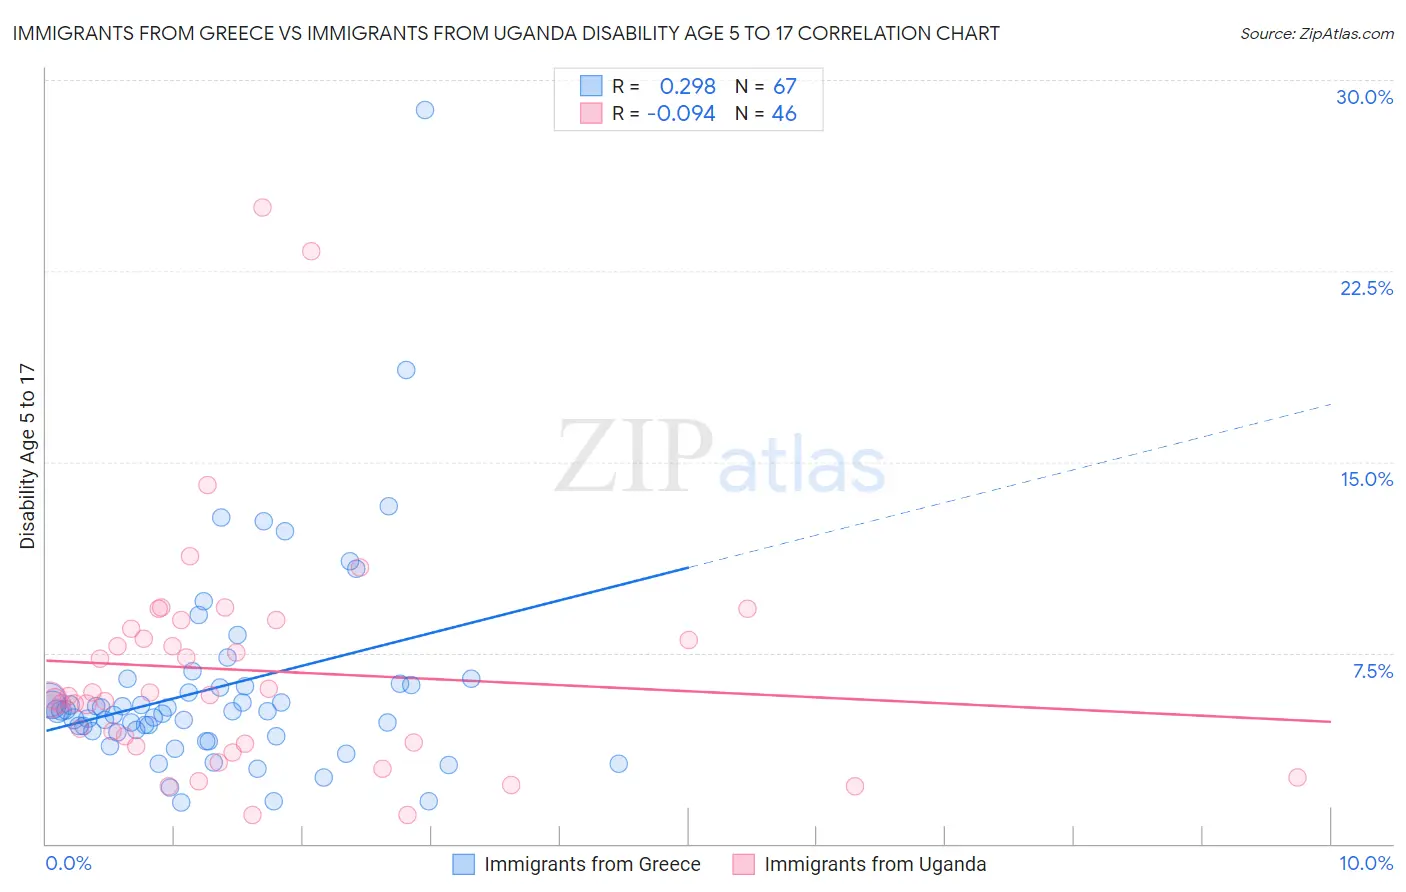
Immigrants from Greece vs Immigrants from Uganda Disability Age 5 to 17 Correlation Chart

The statistical analysis conducted on geographies consisting of 215,473,396 people shows a weak positive correlation between the proportion of Immigrants from Greece and percentage of population with a disability between the ages 5 and 17 in the United States with a correlation coefficient (R) of 0.298 and weighted average of 5.2%. Similarly, the statistical analysis conducted on geographies consisting of 125,737,138 people shows a slight negative correlation between the proportion of Immigrants from Uganda and percentage of population with a disability between the ages 5 and 17 in the United States with a correlation coefficient (R) of -0.094 and weighted average of 5.8%, a difference of 11.2%.
Immigrants from Greece vs Immigrants from Uganda Disability Age 5 to 17

Disability Age 5 to 17 Correlation Summary

MeasurementImmigrants from GreeceImmigrants from Uganda
Minimum1.6%1.1%
Maximum28.8%25.0%
Range27.2%23.9%
Mean6.1%6.8%
Median5.2%5.8%
Interquartile 25% (IQ1)4.4%3.9%
Interquartile 75% (IQ3)6.2%8.5%
Interquartile Range (IQR)1.9%4.5%
Standard Deviation (Sample)4.1%4.7%
Standard Deviation (Population)4.1%4.6%

Similar Demographics by Disability Age 5 to 17

Demographics Similar to Immigrants from Greece by Disability Age 5 to 17

In terms of disability age 5 to 17, the demographic groups most similar to Immigrants from Greece are Immigrants from South Eastern Asia (5.2%, a difference of 0.010%), Immigrants from Bangladesh (5.2%, a difference of 0.040%), Palestinian (5.2%, a difference of 0.040%), Macedonian (5.2%, a difference of 0.070%), and Immigrants from Ireland (5.2%, a difference of 0.15%).
DemographicsRating | RankDisability Age 5 to 17
Immigrants | Ukraine
99.9
/100
|
#58
Exceptional
5.1%
Immigrants | North Macedonia
99.9
/100
|
#59
Exceptional
5.1%
Immigrants | Eastern Europe
99.9
/100
|
#60
Exceptional
5.1%
Immigrants | Switzerland
99.8
/100
|
#61
Exceptional
5.2%
Immigrants | Ireland
99.8
/100
|
#62
Exceptional
5.2%
Immigrants | Bangladesh
99.8
/100
|
#63
Exceptional
5.2%
Immigrants | South Eastern Asia
99.8
/100
|
#64
Exceptional
5.2%
Immigrants | Greece
99.8
/100
|
#65
Exceptional
5.2%
Palestinians
99.8
/100
|
#66
Exceptional
5.2%
Macedonians
99.8
/100
|
#67
Exceptional
5.2%
Immigrants | Syria
99.7
/100
|
#68
Exceptional
5.2%
Guyanese
99.7
/100
|
#69
Exceptional
5.2%
Immigrants | Belgium
99.7
/100
|
#70
Exceptional
5.2%
Jordanians
99.7
/100
|
#71
Exceptional
5.2%
Immigrants | Vietnam
99.7
/100
|
#72
Exceptional
5.2%

Demographics Similar to Immigrants from Uganda by Disability Age 5 to 17

In terms of disability age 5 to 17, the demographic groups most similar to Immigrants from Uganda are Immigrants from Haiti (5.8%, a difference of 0.030%), Kenyan (5.8%, a difference of 0.040%), Yugoslavian (5.8%, a difference of 0.080%), Moroccan (5.7%, a difference of 0.090%), and Trinidadian and Tobagonian (5.7%, a difference of 0.14%).
DemographicsRating | RankDisability Age 5 to 17
Austrians
13.2
/100
|
#202
Poor
5.7%
Spanish American Indians
12.8
/100
|
#203
Poor
5.7%
Paiute
11.2
/100
|
#204
Poor
5.7%
Trinidadians and Tobagonians
10.8
/100
|
#205
Poor
5.7%
Immigrants | Africa
10.8
/100
|
#206
Poor
5.7%
Moroccans
10.4
/100
|
#207
Poor
5.7%
Kenyans
10.0
/100
|
#208
Poor
5.8%
Immigrants | Uganda
9.7
/100
|
#209
Tragic
5.8%
Immigrants | Haiti
9.5
/100
|
#210
Tragic
5.8%
Yugoslavians
9.1
/100
|
#211
Tragic
5.8%
Immigrants | Panama
8.7
/100
|
#212
Tragic
5.8%
Immigrants | Cameroon
8.3
/100
|
#213
Tragic
5.8%
Immigrants | Morocco
8.3
/100
|
#214
Tragic
5.8%
Swedes
8.1
/100
|
#215
Tragic
5.8%
Nigerians
7.5
/100
|
#216
Tragic
5.8%