Liberian vs Immigrants from Uganda Disability Age 5 to 17
COMPARE
Liberian
Immigrants from Uganda
Disability Age 5 to 17
Disability Age 5 to 17 Comparison
Liberians
Immigrants from Uganda
6.0%
DISABILITY AGE 5 TO 17
0.4/ 100
METRIC RATING
269th/ 347
METRIC RANK
5.8%
DISABILITY AGE 5 TO 17
9.7/ 100
METRIC RATING
209th/ 347
METRIC RANK
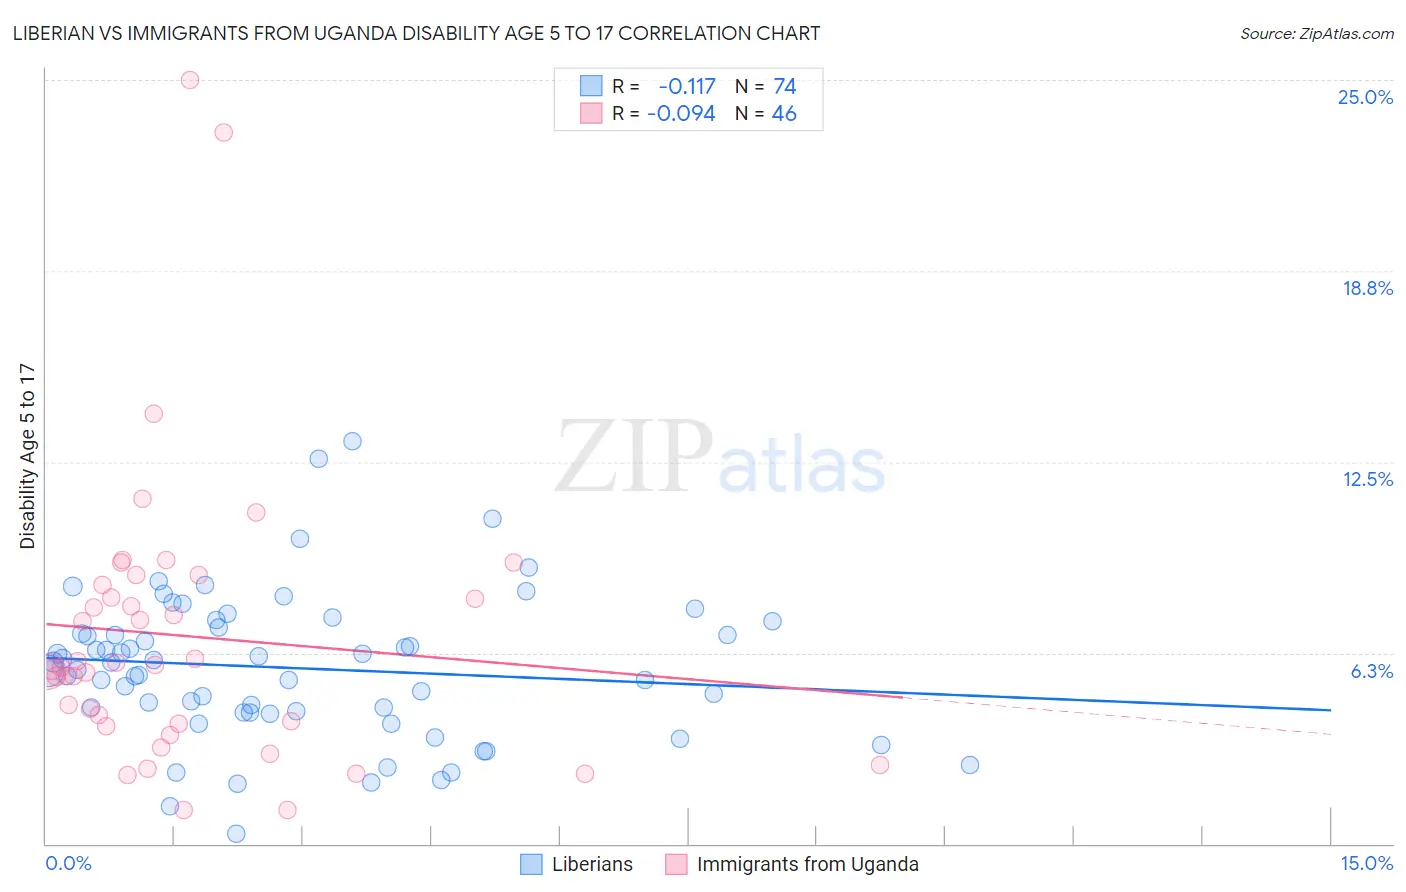
Liberian vs Immigrants from Uganda Disability Age 5 to 17 Correlation Chart
The statistical analysis conducted on geographies consisting of 117,862,309 people shows a poor negative correlation between the proportion of Liberians and percentage of population with a disability between the ages 5 and 17 in the United States with a correlation coefficient (R) of -0.117 and weighted average of 6.0%. Similarly, the statistical analysis conducted on geographies consisting of 125,737,138 people shows a slight negative correlation between the proportion of Immigrants from Uganda and percentage of population with a disability between the ages 5 and 17 in the United States with a correlation coefficient (R) of -0.094 and weighted average of 5.8%, a difference of 3.9%.
Disability Age 5 to 17 Correlation Summary
| Measurement | Liberian | Immigrants from Uganda |
| Minimum | 0.34% | 1.1% |
| Maximum | 13.2% | 25.0% |
| Range | 12.8% | 23.9% |
| Mean | 5.7% | 6.8% |
| Median | 5.8% | 5.8% |
| Interquartile 25% (IQ1) | 4.3% | 3.9% |
| Interquartile 75% (IQ3) | 7.1% | 8.5% |
| Interquartile Range (IQR) | 2.8% | 4.5% |
| Standard Deviation (Sample) | 2.4% | 4.7% |
| Standard Deviation (Population) | 2.4% | 4.6% |
Similar Demographics by Disability Age 5 to 17
Demographics Similar to Liberians by Disability Age 5 to 17
In terms of disability age 5 to 17, the demographic groups most similar to Liberians are Sioux (6.0%, a difference of 0.030%), Immigrants from Somalia (6.0%, a difference of 0.19%), Spanish (6.0%, a difference of 0.22%), Slovene (6.0%, a difference of 0.33%), and Panamanian (6.0%, a difference of 0.36%).
| Demographics | Rating | Rank | Disability Age 5 to 17 |
| Immigrants | Western Africa | 0.7 /100 | #262 | Tragic 5.9% |
| Czechoslovakians | 0.7 /100 | #263 | Tragic 5.9% |
| Canadians | 0.6 /100 | #264 | Tragic 6.0% |
| Panamanians | 0.6 /100 | #265 | Tragic 6.0% |
| Slovenes | 0.6 /100 | #266 | Tragic 6.0% |
| Spanish | 0.5 /100 | #267 | Tragic 6.0% |
| Sioux | 0.4 /100 | #268 | Tragic 6.0% |
| Liberians | 0.4 /100 | #269 | Tragic 6.0% |
| Immigrants | Somalia | 0.4 /100 | #270 | Tragic 6.0% |
| Immigrants | Zaire | 0.2 /100 | #271 | Tragic 6.0% |
| Finns | 0.2 /100 | #272 | Tragic 6.0% |
| Alaska Natives | 0.2 /100 | #273 | Tragic 6.0% |
| Cheyenne | 0.2 /100 | #274 | Tragic 6.0% |
| Dutch | 0.2 /100 | #275 | Tragic 6.0% |
| Japanese | 0.1 /100 | #276 | Tragic 6.1% |
Demographics Similar to Immigrants from Uganda by Disability Age 5 to 17
In terms of disability age 5 to 17, the demographic groups most similar to Immigrants from Uganda are Immigrants from Haiti (5.8%, a difference of 0.030%), Kenyan (5.8%, a difference of 0.040%), Yugoslavian (5.8%, a difference of 0.080%), Moroccan (5.7%, a difference of 0.090%), and Trinidadian and Tobagonian (5.7%, a difference of 0.14%).
| Demographics | Rating | Rank | Disability Age 5 to 17 |
| Austrians | 13.2 /100 | #202 | Poor 5.7% |
| Spanish American Indians | 12.8 /100 | #203 | Poor 5.7% |
| Paiute | 11.2 /100 | #204 | Poor 5.7% |
| Trinidadians and Tobagonians | 10.8 /100 | #205 | Poor 5.7% |
| Immigrants | Africa | 10.8 /100 | #206 | Poor 5.7% |
| Moroccans | 10.4 /100 | #207 | Poor 5.7% |
| Kenyans | 10.0 /100 | #208 | Poor 5.8% |
| Immigrants | Uganda | 9.7 /100 | #209 | Tragic 5.8% |
| Immigrants | Haiti | 9.5 /100 | #210 | Tragic 5.8% |
| Yugoslavians | 9.1 /100 | #211 | Tragic 5.8% |
| Immigrants | Panama | 8.7 /100 | #212 | Tragic 5.8% |
| Immigrants | Cameroon | 8.3 /100 | #213 | Tragic 5.8% |
| Immigrants | Morocco | 8.3 /100 | #214 | Tragic 5.8% |
| Swedes | 8.1 /100 | #215 | Tragic 5.8% |
| Nigerians | 7.5 /100 | #216 | Tragic 5.8% |