Immigrants from Kenya vs South African Male Disability
COMPARE
Immigrants from Kenya
South African
Male Disability
Male Disability Comparison
Immigrants from Kenya
South Africans
11.1%
MALE DISABILITY
63.8/ 100
METRIC RATING
163rd/ 347
METRIC RANK
11.0%
MALE DISABILITY
81.7/ 100
METRIC RATING
139th/ 347
METRIC RANK
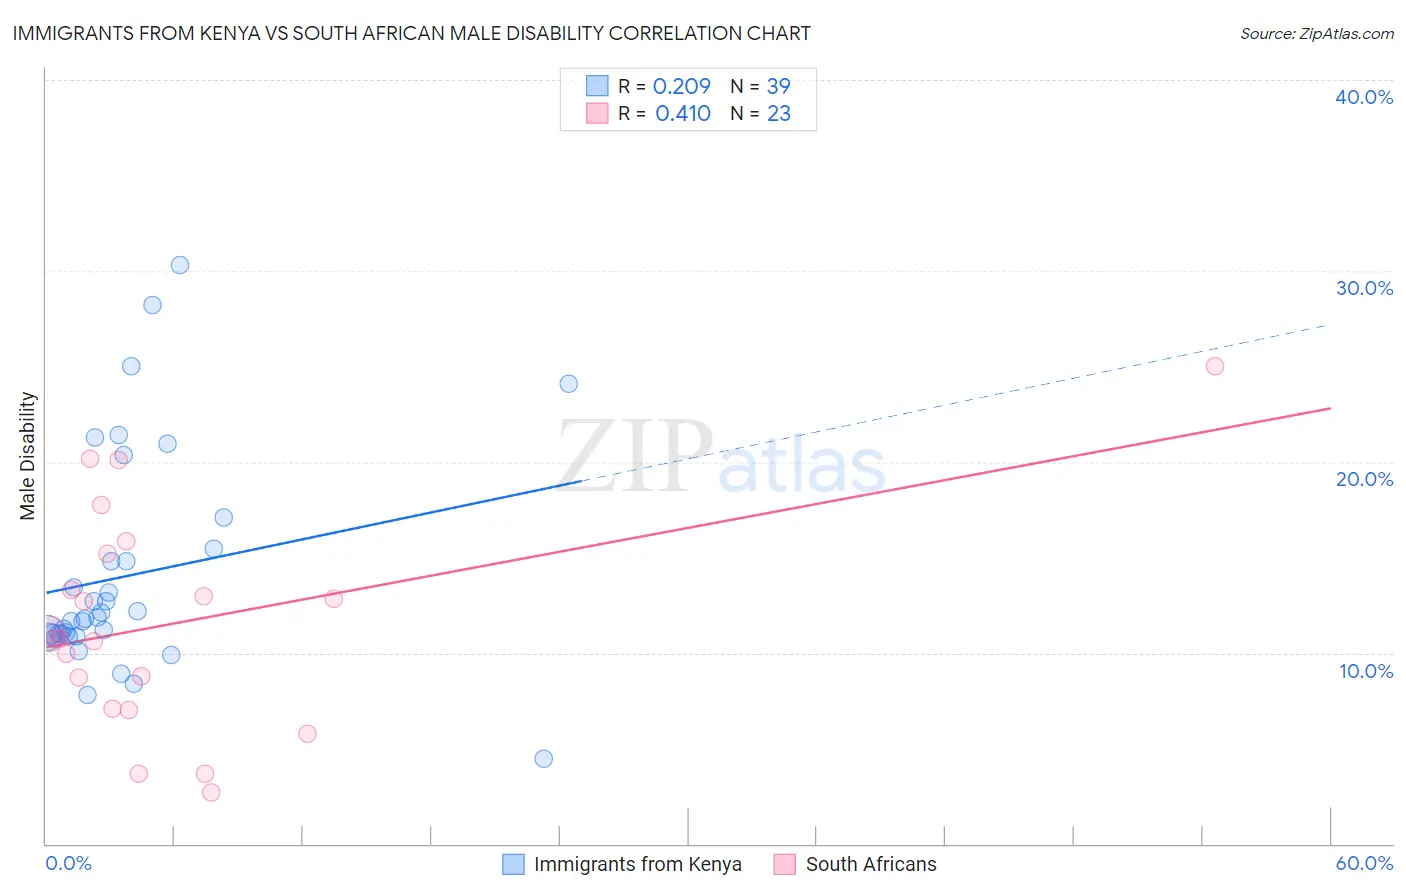
Immigrants from Kenya vs South African Male Disability Correlation Chart
The statistical analysis conducted on geographies consisting of 218,057,071 people shows a weak positive correlation between the proportion of Immigrants from Kenya and percentage of males with a disability in the United States with a correlation coefficient (R) of 0.209 and weighted average of 11.1%. Similarly, the statistical analysis conducted on geographies consisting of 182,590,861 people shows a moderate positive correlation between the proportion of South Africans and percentage of males with a disability in the United States with a correlation coefficient (R) of 0.410 and weighted average of 11.0%, a difference of 1.3%.
Male Disability Correlation Summary
| Measurement | Immigrants from Kenya | South African |
| Minimum | 4.4% | 2.7% |
| Maximum | 30.3% | 25.0% |
| Range | 25.8% | 22.3% |
| Mean | 14.0% | 11.6% |
| Median | 11.8% | 10.8% |
| Interquartile 25% (IQ1) | 11.0% | 7.1% |
| Interquartile 75% (IQ3) | 15.4% | 15.2% |
| Interquartile Range (IQR) | 4.4% | 8.1% |
| Standard Deviation (Sample) | 5.7% | 5.7% |
| Standard Deviation (Population) | 5.7% | 5.5% |
Similar Demographics by Male Disability
Demographics Similar to Immigrants from Kenya by Male Disability
In terms of male disability, the demographic groups most similar to Immigrants from Kenya are British West Indian (11.1%, a difference of 0.060%), Immigrants from Haiti (11.1%, a difference of 0.090%), Luxembourger (11.1%, a difference of 0.11%), Immigrants from West Indies (11.1%, a difference of 0.12%), and Immigrants from Hungary (11.1%, a difference of 0.15%).
| Demographics | Rating | Rank | Male Disability |
| Russians | 69.8 /100 | #156 | Good 11.1% |
| Immigrants | Western Africa | 69.2 /100 | #157 | Good 11.1% |
| Latvians | 68.1 /100 | #158 | Good 11.1% |
| Guatemalans | 67.2 /100 | #159 | Good 11.1% |
| Albanians | 66.5 /100 | #160 | Good 11.1% |
| Immigrants | West Indies | 65.7 /100 | #161 | Good 11.1% |
| Immigrants | Haiti | 65.3 /100 | #162 | Good 11.1% |
| Immigrants | Kenya | 63.8 /100 | #163 | Good 11.1% |
| British West Indians | 62.8 /100 | #164 | Good 11.1% |
| Luxembourgers | 61.9 /100 | #165 | Good 11.1% |
| Immigrants | Hungary | 61.2 /100 | #166 | Good 11.1% |
| Immigrants | Southern Europe | 54.4 /100 | #167 | Average 11.2% |
| Immigrants | Latin America | 54.0 /100 | #168 | Average 11.2% |
| Barbadians | 53.4 /100 | #169 | Average 11.2% |
| New Zealanders | 52.9 /100 | #170 | Average 11.2% |
Demographics Similar to South Africans by Male Disability
In terms of male disability, the demographic groups most similar to South Africans are Nigerian (11.0%, a difference of 0.020%), Immigrants from Italy (11.0%, a difference of 0.020%), Arab (11.0%, a difference of 0.020%), Immigrants from Sudan (11.0%, a difference of 0.020%), and Immigrants from Europe (11.0%, a difference of 0.030%).
| Demographics | Rating | Rank | Male Disability |
| Immigrants | Fiji | 84.0 /100 | #132 | Excellent 11.0% |
| Ugandans | 83.9 /100 | #133 | Excellent 11.0% |
| Bhutanese | 83.4 /100 | #134 | Excellent 11.0% |
| Trinidadians and Tobagonians | 83.3 /100 | #135 | Excellent 11.0% |
| Immigrants | Costa Rica | 82.8 /100 | #136 | Excellent 11.0% |
| Immigrants | Europe | 82.0 /100 | #137 | Excellent 11.0% |
| Nigerians | 81.9 /100 | #138 | Excellent 11.0% |
| South Africans | 81.7 /100 | #139 | Excellent 11.0% |
| Immigrants | Italy | 81.5 /100 | #140 | Excellent 11.0% |
| Arabs | 81.5 /100 | #141 | Excellent 11.0% |
| Immigrants | Sudan | 81.5 /100 | #142 | Excellent 11.0% |
| Moroccans | 80.7 /100 | #143 | Excellent 11.0% |
| Kenyans | 78.1 /100 | #144 | Good 11.0% |
| Costa Ricans | 78.0 /100 | #145 | Good 11.0% |
| Koreans | 77.5 /100 | #146 | Good 11.0% |