Ute vs Immigrants from Panama Self-Care Disability
COMPARE
Ute
Immigrants from Panama
Self-Care Disability
Self-Care Disability Comparison
Ute
Immigrants from Panama
2.5%
SELF-CARE DISABILITY
57.1/ 100
METRIC RATING
168th/ 347
METRIC RANK
2.6%
SELF-CARE DISABILITY
1.2/ 100
METRIC RATING
239th/ 347
METRIC RANK
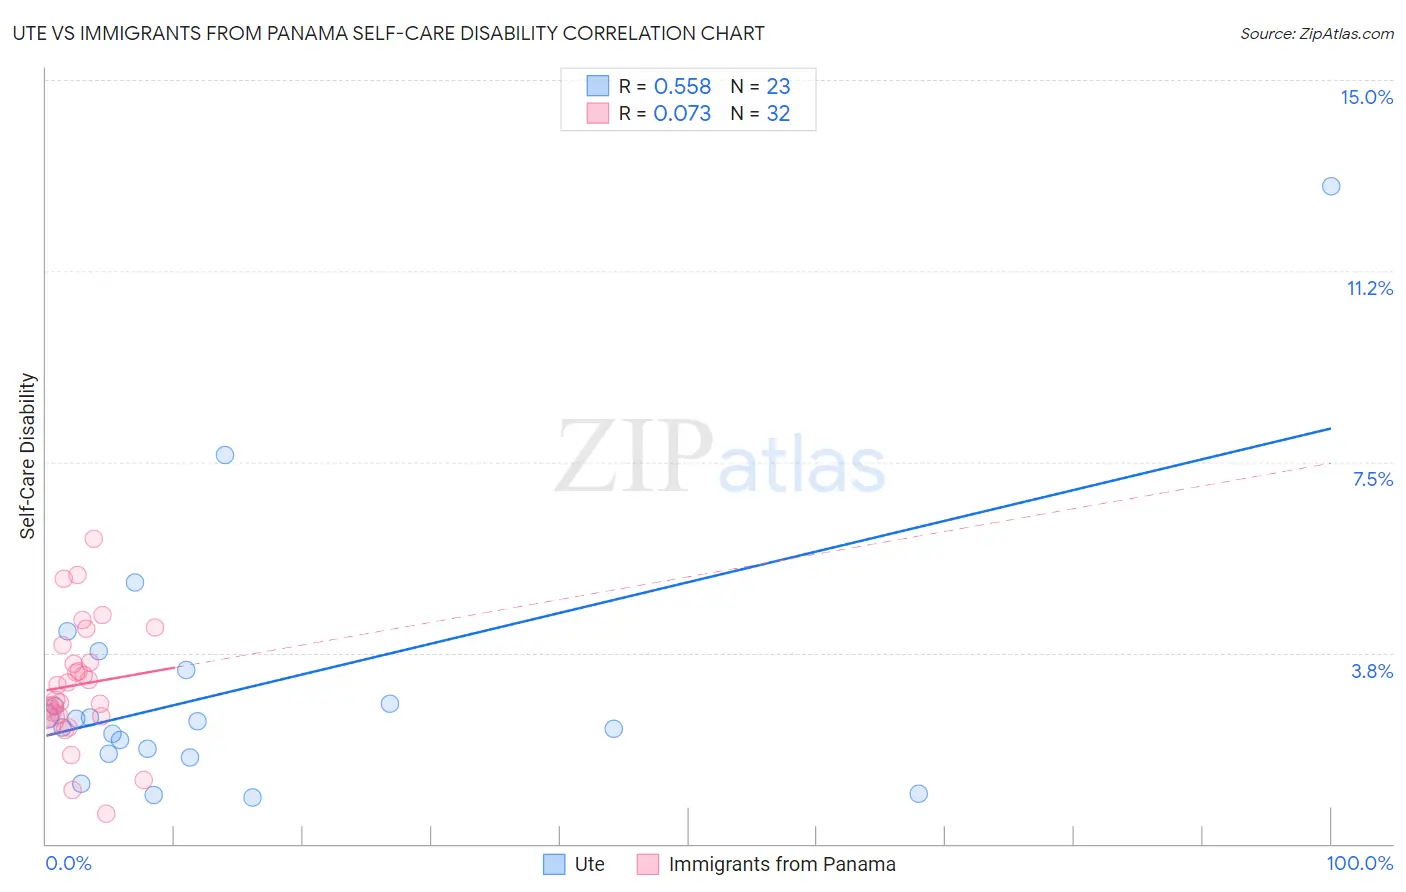
Ute vs Immigrants from Panama Self-Care Disability Correlation Chart
The statistical analysis conducted on geographies consisting of 55,649,381 people shows a substantial positive correlation between the proportion of Ute and percentage of population with self-care disability in the United States with a correlation coefficient (R) of 0.558 and weighted average of 2.5%. Similarly, the statistical analysis conducted on geographies consisting of 221,140,353 people shows a slight positive correlation between the proportion of Immigrants from Panama and percentage of population with self-care disability in the United States with a correlation coefficient (R) of 0.073 and weighted average of 2.6%, a difference of 5.6%.
Self-Care Disability Correlation Summary
| Measurement | Ute | Immigrants from Panama |
| Minimum | 0.91% | 0.60% |
| Maximum | 12.9% | 6.0% |
| Range | 12.0% | 5.4% |
| Mean | 3.1% | 3.1% |
| Median | 2.4% | 3.0% |
| Interquartile 25% (IQ1) | 1.8% | 2.5% |
| Interquartile 75% (IQ3) | 3.4% | 3.7% |
| Interquartile Range (IQR) | 1.7% | 1.2% |
| Standard Deviation (Sample) | 2.6% | 1.2% |
| Standard Deviation (Population) | 2.6% | 1.2% |
Similar Demographics by Self-Care Disability
Demographics Similar to Ute by Self-Care Disability
In terms of self-care disability, the demographic groups most similar to Ute are Immigrants from Greece (2.5%, a difference of 0.010%), Immigrants from Somalia (2.5%, a difference of 0.060%), Canadian (2.5%, a difference of 0.080%), Syrian (2.5%, a difference of 0.090%), and Immigrants from Vietnam (2.5%, a difference of 0.11%).
| Demographics | Rating | Rank | Self-Care Disability |
| Lebanese | 66.5 /100 | #161 | Good 2.4% |
| Somalis | 63.7 /100 | #162 | Good 2.5% |
| German Russians | 62.7 /100 | #163 | Good 2.5% |
| Immigrants | Vietnam | 59.3 /100 | #164 | Average 2.5% |
| Syrians | 59.0 /100 | #165 | Average 2.5% |
| Canadians | 58.8 /100 | #166 | Average 2.5% |
| Immigrants | Greece | 57.3 /100 | #167 | Average 2.5% |
| Ute | 57.1 /100 | #168 | Average 2.5% |
| Immigrants | Somalia | 55.9 /100 | #169 | Average 2.5% |
| Scottish | 54.3 /100 | #170 | Average 2.5% |
| Pennsylvania Germans | 53.5 /100 | #171 | Average 2.5% |
| Czechoslovakians | 53.5 /100 | #172 | Average 2.5% |
| Immigrants | Burma/Myanmar | 52.8 /100 | #173 | Average 2.5% |
| Welsh | 50.0 /100 | #174 | Average 2.5% |
| Immigrants | Bosnia and Herzegovina | 49.6 /100 | #175 | Average 2.5% |
Demographics Similar to Immigrants from Panama by Self-Care Disability
In terms of self-care disability, the demographic groups most similar to Immigrants from Panama are Marshallese (2.6%, a difference of 0.030%), Senegalese (2.6%, a difference of 0.040%), Immigrants from Syria (2.6%, a difference of 0.20%), Immigrants from Senegal (2.6%, a difference of 0.31%), and Spanish (2.6%, a difference of 0.43%).
| Demographics | Rating | Rank | Self-Care Disability |
| Albanians | 2.2 /100 | #232 | Tragic 2.6% |
| Liberians | 2.1 /100 | #233 | Tragic 2.6% |
| Vietnamese | 2.1 /100 | #234 | Tragic 2.6% |
| Bahamians | 2.0 /100 | #235 | Tragic 2.6% |
| Bermudans | 1.9 /100 | #236 | Tragic 2.6% |
| Immigrants | Senegal | 1.6 /100 | #237 | Tragic 2.6% |
| Senegalese | 1.3 /100 | #238 | Tragic 2.6% |
| Immigrants | Panama | 1.2 /100 | #239 | Tragic 2.6% |
| Marshallese | 1.2 /100 | #240 | Tragic 2.6% |
| Immigrants | Syria | 1.0 /100 | #241 | Tragic 2.6% |
| Spanish | 0.8 /100 | #242 | Tragic 2.6% |
| Hawaiians | 0.8 /100 | #243 | Tragic 2.6% |
| Yuman | 0.8 /100 | #244 | Tragic 2.6% |
| Immigrants | Western Asia | 0.6 /100 | #245 | Tragic 2.6% |
| Cheyenne | 0.6 /100 | #246 | Tragic 2.6% |