Immigrants from Ghana vs Immigrants from Kuwait Self-Care Disability
COMPARE
Immigrants from Ghana
Immigrants from Kuwait
Self-Care Disability
Self-Care Disability Comparison
Immigrants from Ghana
Immigrants from Kuwait
2.5%
SELF-CARE DISABILITY
14.7/ 100
METRIC RATING
199th/ 347
METRIC RANK
2.2%
SELF-CARE DISABILITY
100.0/ 100
METRIC RATING
16th/ 347
METRIC RANK
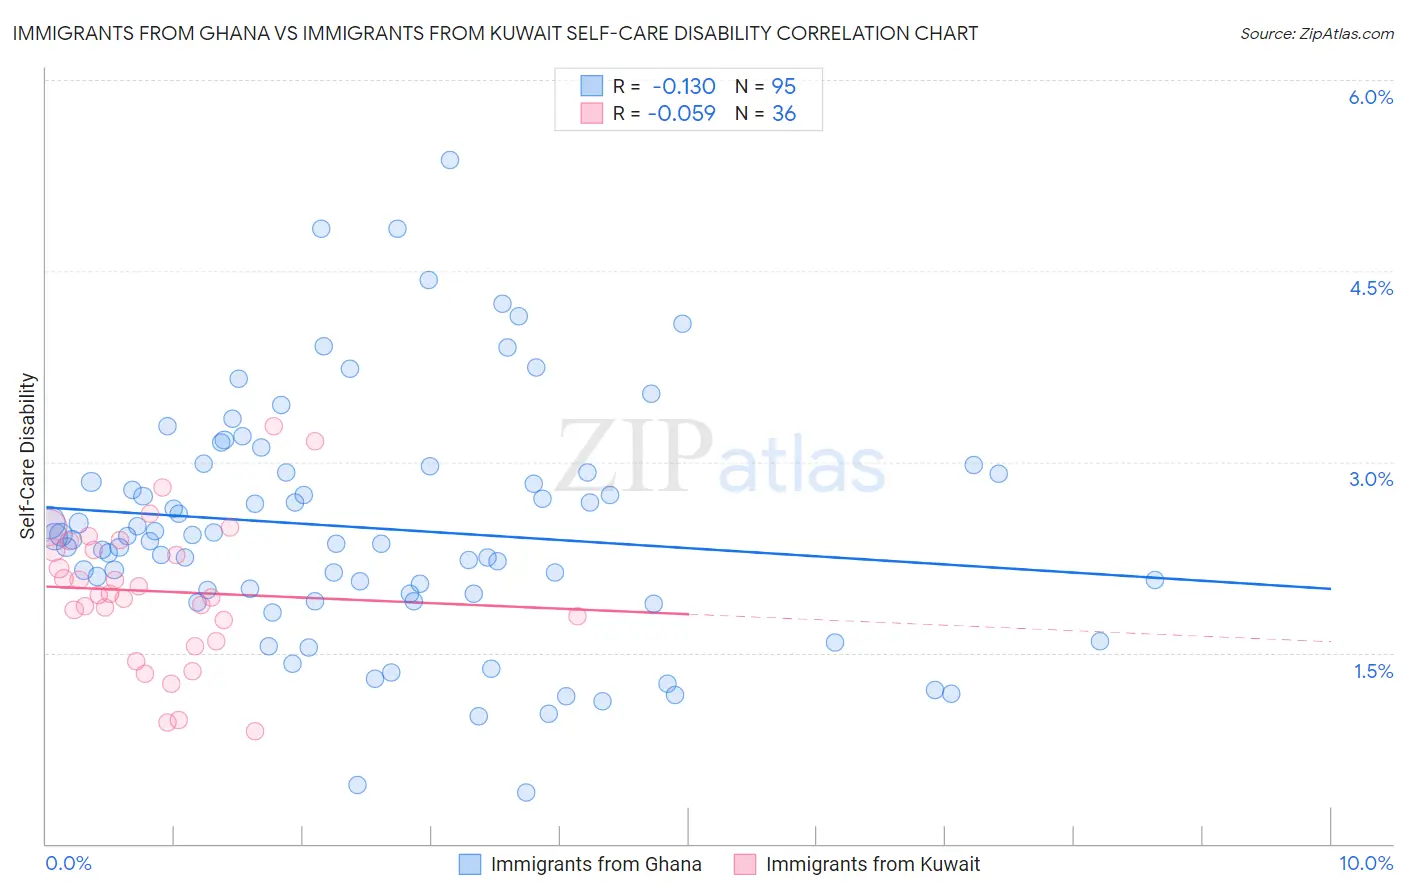
Immigrants from Ghana vs Immigrants from Kuwait Self-Care Disability Correlation Chart
The statistical analysis conducted on geographies consisting of 199,790,257 people shows a poor negative correlation between the proportion of Immigrants from Ghana and percentage of population with self-care disability in the United States with a correlation coefficient (R) of -0.130 and weighted average of 2.5%. Similarly, the statistical analysis conducted on geographies consisting of 136,859,036 people shows a slight negative correlation between the proportion of Immigrants from Kuwait and percentage of population with self-care disability in the United States with a correlation coefficient (R) of -0.059 and weighted average of 2.2%, a difference of 14.2%.
Self-Care Disability Correlation Summary
| Measurement | Immigrants from Ghana | Immigrants from Kuwait |
| Minimum | 0.40% | 0.88% |
| Maximum | 5.4% | 3.3% |
| Range | 5.0% | 2.4% |
| Mean | 2.5% | 2.0% |
| Median | 2.4% | 2.0% |
| Interquartile 25% (IQ1) | 2.0% | 1.7% |
| Interquartile 75% (IQ3) | 2.9% | 2.3% |
| Interquartile Range (IQR) | 0.96% | 0.67% |
| Standard Deviation (Sample) | 0.94% | 0.56% |
| Standard Deviation (Population) | 0.94% | 0.55% |
Similar Demographics by Self-Care Disability
Demographics Similar to Immigrants from Ghana by Self-Care Disability
In terms of self-care disability, the demographic groups most similar to Immigrants from Ghana are Immigrants (2.5%, a difference of 0.020%), Crow (2.5%, a difference of 0.050%), Korean (2.5%, a difference of 0.070%), Immigrants from Southern Europe (2.5%, a difference of 0.080%), and Immigrants from Western Africa (2.5%, a difference of 0.14%).
| Demographics | Rating | Rank | Self-Care Disability |
| Soviet Union | 22.2 /100 | #192 | Fair 2.5% |
| Ukrainians | 21.4 /100 | #193 | Fair 2.5% |
| Immigrants | Germany | 17.9 /100 | #194 | Poor 2.5% |
| Immigrants | Southern Europe | 15.6 /100 | #195 | Poor 2.5% |
| Koreans | 15.5 /100 | #196 | Poor 2.5% |
| Crow | 15.2 /100 | #197 | Poor 2.5% |
| Immigrants | Immigrants | 15.0 /100 | #198 | Poor 2.5% |
| Immigrants | Ghana | 14.7 /100 | #199 | Poor 2.5% |
| Immigrants | Western Africa | 13.3 /100 | #200 | Poor 2.5% |
| Immigrants | South Eastern Asia | 12.9 /100 | #201 | Poor 2.5% |
| Slovaks | 12.6 /100 | #202 | Poor 2.5% |
| Immigrants | Lebanon | 12.4 /100 | #203 | Poor 2.5% |
| Immigrants | Bahamas | 11.9 /100 | #204 | Poor 2.5% |
| Immigrants | Russia | 11.0 /100 | #205 | Poor 2.5% |
| Alaskan Athabascans | 10.4 /100 | #206 | Poor 2.5% |
Demographics Similar to Immigrants from Kuwait by Self-Care Disability
In terms of self-care disability, the demographic groups most similar to Immigrants from Kuwait are Immigrants from Saudi Arabia (2.2%, a difference of 0.16%), Okinawan (2.2%, a difference of 0.28%), Luxembourger (2.2%, a difference of 0.29%), Immigrants from Taiwan (2.2%, a difference of 0.42%), and Ethiopian (2.2%, a difference of 0.45%).
| Demographics | Rating | Rank | Self-Care Disability |
| Immigrants | Nepal | 100.0 /100 | #9 | Exceptional 2.2% |
| Sudanese | 100.0 /100 | #10 | Exceptional 2.2% |
| Immigrants | South Central Asia | 100.0 /100 | #11 | Exceptional 2.2% |
| Immigrants | Ethiopia | 100.0 /100 | #12 | Exceptional 2.2% |
| Ethiopians | 100.0 /100 | #13 | Exceptional 2.2% |
| Luxembourgers | 100.0 /100 | #14 | Exceptional 2.2% |
| Okinawans | 100.0 /100 | #15 | Exceptional 2.2% |
| Immigrants | Kuwait | 100.0 /100 | #16 | Exceptional 2.2% |
| Immigrants | Saudi Arabia | 100.0 /100 | #17 | Exceptional 2.2% |
| Immigrants | Taiwan | 100.0 /100 | #18 | Exceptional 2.2% |
| Immigrants | Eritrea | 100.0 /100 | #19 | Exceptional 2.2% |
| Tongans | 100.0 /100 | #20 | Exceptional 2.2% |
| Bulgarians | 100.0 /100 | #21 | Exceptional 2.2% |
| Immigrants | Venezuela | 100.0 /100 | #22 | Exceptional 2.2% |
| Cambodians | 100.0 /100 | #23 | Exceptional 2.2% |