Russian vs Immigrants from Panama Self-Care Disability
COMPARE
Russian
Immigrants from Panama
Self-Care Disability
Self-Care Disability Comparison
Russians
Immigrants from Panama
2.4%
SELF-CARE DISABILITY
88.2/ 100
METRIC RATING
134th/ 347
METRIC RANK
2.6%
SELF-CARE DISABILITY
1.2/ 100
METRIC RATING
239th/ 347
METRIC RANK
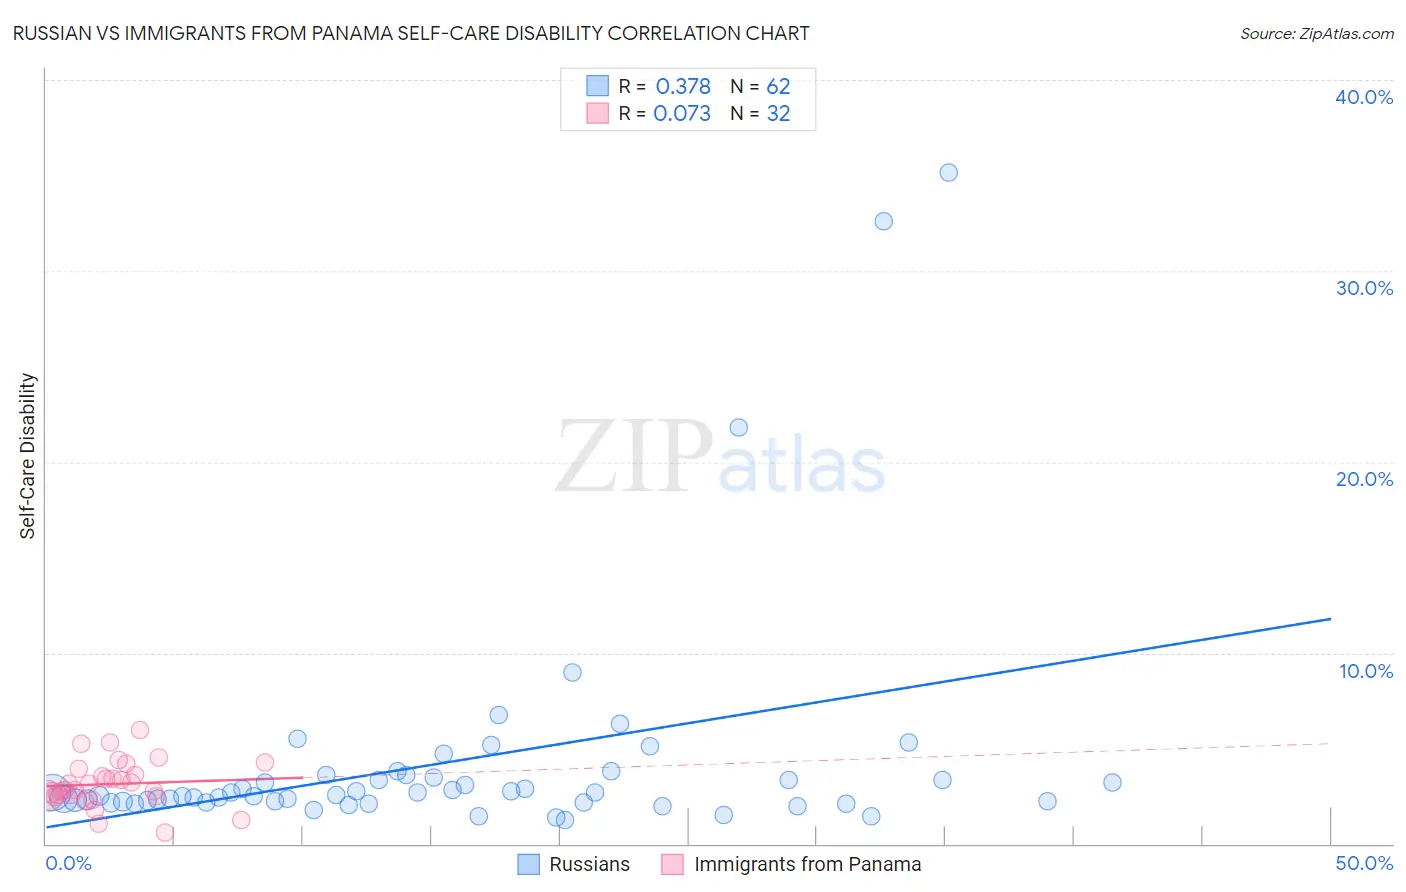
Russian vs Immigrants from Panama Self-Care Disability Correlation Chart
The statistical analysis conducted on geographies consisting of 510,848,138 people shows a mild positive correlation between the proportion of Russians and percentage of population with self-care disability in the United States with a correlation coefficient (R) of 0.378 and weighted average of 2.4%. Similarly, the statistical analysis conducted on geographies consisting of 221,140,353 people shows a slight positive correlation between the proportion of Immigrants from Panama and percentage of population with self-care disability in the United States with a correlation coefficient (R) of 0.073 and weighted average of 2.6%, a difference of 7.8%.
Self-Care Disability Correlation Summary
| Measurement | Russian | Immigrants from Panama |
| Minimum | 1.2% | 0.60% |
| Maximum | 35.1% | 6.0% |
| Range | 33.9% | 5.4% |
| Mean | 4.3% | 3.1% |
| Median | 2.6% | 3.0% |
| Interquartile 25% (IQ1) | 2.2% | 2.5% |
| Interquartile 75% (IQ3) | 3.4% | 3.7% |
| Interquartile Range (IQR) | 1.2% | 1.2% |
| Standard Deviation (Sample) | 6.1% | 1.2% |
| Standard Deviation (Population) | 6.1% | 1.2% |
Similar Demographics by Self-Care Disability
Demographics Similar to Russians by Self-Care Disability
In terms of self-care disability, the demographic groups most similar to Russians are Immigrants from Colombia (2.4%, a difference of 0.040%), Laotian (2.4%, a difference of 0.050%), Immigrants from South America (2.4%, a difference of 0.070%), Polish (2.4%, a difference of 0.080%), and Immigrants from Austria (2.4%, a difference of 0.10%).
| Demographics | Rating | Rank | Self-Care Disability |
| Colombians | 89.7 /100 | #127 | Excellent 2.4% |
| Immigrants | Hungary | 89.6 /100 | #128 | Excellent 2.4% |
| Immigrants | Romania | 89.3 /100 | #129 | Excellent 2.4% |
| Immigrants | Austria | 89.0 /100 | #130 | Excellent 2.4% |
| Poles | 88.9 /100 | #131 | Excellent 2.4% |
| Immigrants | South America | 88.8 /100 | #132 | Excellent 2.4% |
| Immigrants | Colombia | 88.5 /100 | #133 | Excellent 2.4% |
| Russians | 88.2 /100 | #134 | Excellent 2.4% |
| Laotians | 87.8 /100 | #135 | Excellent 2.4% |
| South American Indians | 87.2 /100 | #136 | Excellent 2.4% |
| Austrians | 87.0 /100 | #137 | Excellent 2.4% |
| Immigrants | Croatia | 86.6 /100 | #138 | Excellent 2.4% |
| Sri Lankans | 86.6 /100 | #139 | Excellent 2.4% |
| Immigrants | Uruguay | 85.4 /100 | #140 | Excellent 2.4% |
| Alaska Natives | 84.5 /100 | #141 | Excellent 2.4% |
Demographics Similar to Immigrants from Panama by Self-Care Disability
In terms of self-care disability, the demographic groups most similar to Immigrants from Panama are Marshallese (2.6%, a difference of 0.030%), Senegalese (2.6%, a difference of 0.040%), Immigrants from Syria (2.6%, a difference of 0.20%), Immigrants from Senegal (2.6%, a difference of 0.31%), and Spanish (2.6%, a difference of 0.43%).
| Demographics | Rating | Rank | Self-Care Disability |
| Albanians | 2.2 /100 | #232 | Tragic 2.6% |
| Liberians | 2.1 /100 | #233 | Tragic 2.6% |
| Vietnamese | 2.1 /100 | #234 | Tragic 2.6% |
| Bahamians | 2.0 /100 | #235 | Tragic 2.6% |
| Bermudans | 1.9 /100 | #236 | Tragic 2.6% |
| Immigrants | Senegal | 1.6 /100 | #237 | Tragic 2.6% |
| Senegalese | 1.3 /100 | #238 | Tragic 2.6% |
| Immigrants | Panama | 1.2 /100 | #239 | Tragic 2.6% |
| Marshallese | 1.2 /100 | #240 | Tragic 2.6% |
| Immigrants | Syria | 1.0 /100 | #241 | Tragic 2.6% |
| Spanish | 0.8 /100 | #242 | Tragic 2.6% |
| Hawaiians | 0.8 /100 | #243 | Tragic 2.6% |
| Yuman | 0.8 /100 | #244 | Tragic 2.6% |
| Immigrants | Western Asia | 0.6 /100 | #245 | Tragic 2.6% |
| Cheyenne | 0.6 /100 | #246 | Tragic 2.6% |