Immigrants from Ghana vs Guyanese Ambulatory Disability
COMPARE
Immigrants from Ghana
Guyanese
Ambulatory Disability
Ambulatory Disability Comparison
Immigrants from Ghana
Guyanese
6.1%
AMBULATORY DISABILITY
41.2/ 100
METRIC RATING
184th/ 347
METRIC RANK
6.6%
AMBULATORY DISABILITY
0.2/ 100
METRIC RATING
266th/ 347
METRIC RANK
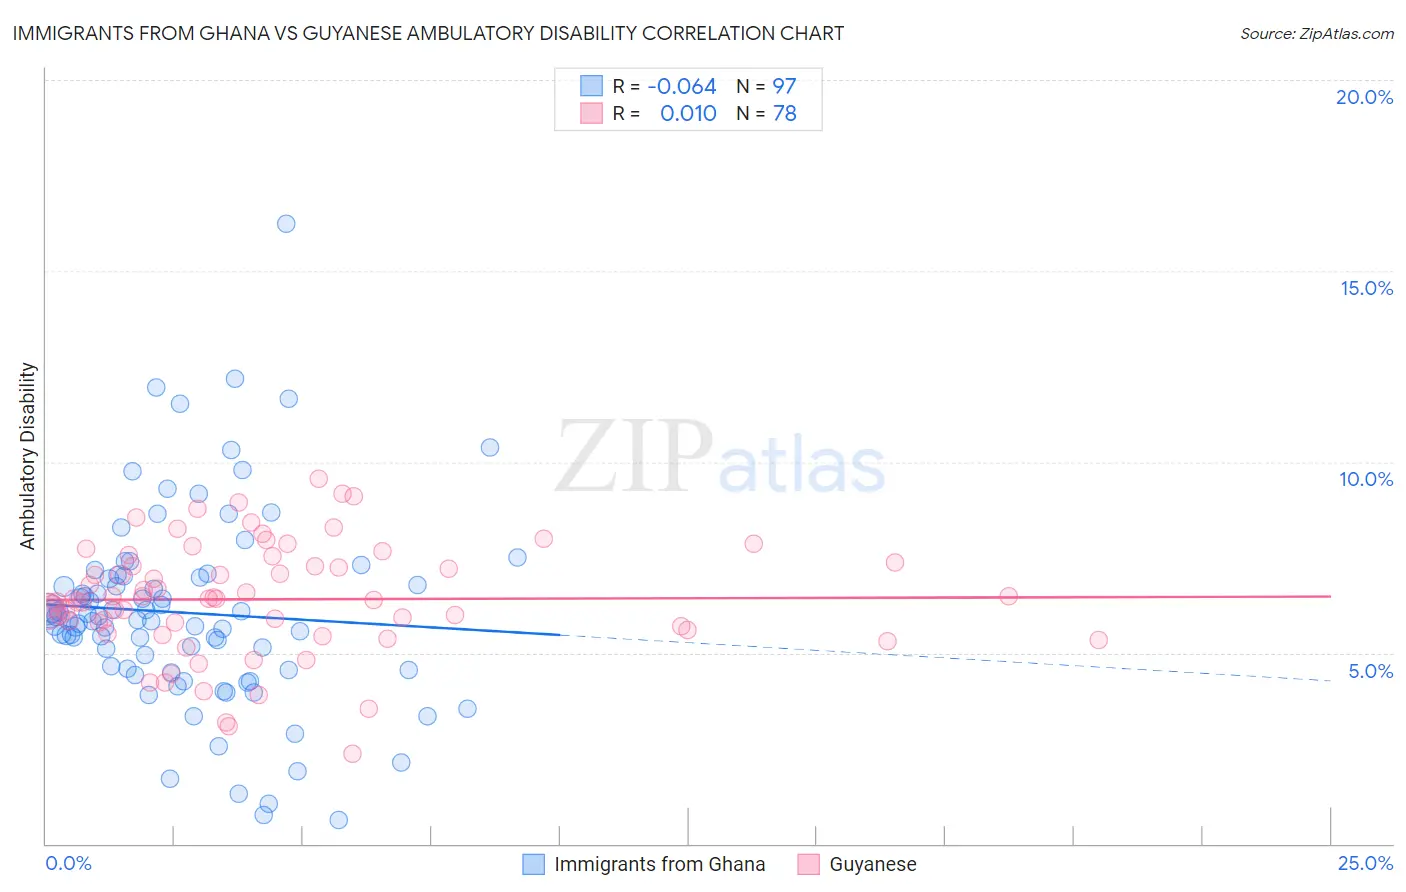
Immigrants from Ghana vs Guyanese Ambulatory Disability Correlation Chart
The statistical analysis conducted on geographies consisting of 199,872,719 people shows a slight negative correlation between the proportion of Immigrants from Ghana and percentage of population with ambulatory disability in the United States with a correlation coefficient (R) of -0.064 and weighted average of 6.1%. Similarly, the statistical analysis conducted on geographies consisting of 176,872,924 people shows no correlation between the proportion of Guyanese and percentage of population with ambulatory disability in the United States with a correlation coefficient (R) of 0.010 and weighted average of 6.6%, a difference of 7.7%.
Ambulatory Disability Correlation Summary
| Measurement | Immigrants from Ghana | Guyanese |
| Minimum | 0.61% | 2.4% |
| Maximum | 16.2% | 9.5% |
| Range | 15.6% | 7.2% |
| Mean | 6.0% | 6.4% |
| Median | 5.9% | 6.4% |
| Interquartile 25% (IQ1) | 4.6% | 5.6% |
| Interquartile 75% (IQ3) | 7.0% | 7.4% |
| Interquartile Range (IQR) | 2.4% | 1.8% |
| Standard Deviation (Sample) | 2.5% | 1.5% |
| Standard Deviation (Population) | 2.5% | 1.5% |
Similar Demographics by Ambulatory Disability
Demographics Similar to Immigrants from Ghana by Ambulatory Disability
In terms of ambulatory disability, the demographic groups most similar to Immigrants from Ghana are Immigrants from Thailand (6.1%, a difference of 0.050%), Serbian (6.1%, a difference of 0.090%), Swiss (6.1%, a difference of 0.10%), Austrian (6.1%, a difference of 0.15%), and Immigrants from Nicaragua (6.1%, a difference of 0.15%).
| Demographics | Rating | Rank | Ambulatory Disability |
| Immigrants | England | 45.4 /100 | #177 | Average 6.1% |
| Scandinavians | 44.5 /100 | #178 | Average 6.1% |
| Austrians | 44.1 /100 | #179 | Average 6.1% |
| Immigrants | Nicaragua | 43.9 /100 | #180 | Average 6.1% |
| Swiss | 43.1 /100 | #181 | Average 6.1% |
| Serbians | 42.8 /100 | #182 | Average 6.1% |
| Immigrants | Thailand | 42.2 /100 | #183 | Average 6.1% |
| Immigrants | Ghana | 41.2 /100 | #184 | Average 6.1% |
| Immigrants | Bosnia and Herzegovina | 37.2 /100 | #185 | Fair 6.2% |
| Europeans | 36.2 /100 | #186 | Fair 6.2% |
| Carpatho Rusyns | 35.3 /100 | #187 | Fair 6.2% |
| British | 34.3 /100 | #188 | Fair 6.2% |
| Ukrainians | 34.0 /100 | #189 | Fair 6.2% |
| Immigrants | Western Africa | 33.4 /100 | #190 | Fair 6.2% |
| Immigrants | Guatemala | 31.9 /100 | #191 | Fair 6.2% |
Demographics Similar to Guyanese by Ambulatory Disability
In terms of ambulatory disability, the demographic groups most similar to Guyanese are Bahamian (6.6%, a difference of 0.12%), Trinidadian and Tobagonian (6.6%, a difference of 0.13%), Spanish (6.6%, a difference of 0.14%), Nepalese (6.6%, a difference of 0.18%), and French (6.6%, a difference of 0.45%).
| Demographics | Rating | Rank | Ambulatory Disability |
| Aleuts | 0.4 /100 | #259 | Tragic 6.6% |
| Immigrants | Belize | 0.4 /100 | #260 | Tragic 6.6% |
| Irish | 0.4 /100 | #261 | Tragic 6.6% |
| English | 0.4 /100 | #262 | Tragic 6.6% |
| Hmong | 0.3 /100 | #263 | Tragic 6.6% |
| Nepalese | 0.2 /100 | #264 | Tragic 6.6% |
| Bahamians | 0.2 /100 | #265 | Tragic 6.6% |
| Guyanese | 0.2 /100 | #266 | Tragic 6.6% |
| Trinidadians and Tobagonians | 0.2 /100 | #267 | Tragic 6.6% |
| Spanish | 0.2 /100 | #268 | Tragic 6.6% |
| French | 0.1 /100 | #269 | Tragic 6.6% |
| Slovaks | 0.1 /100 | #270 | Tragic 6.7% |
| Immigrants | Trinidad and Tobago | 0.1 /100 | #271 | Tragic 6.7% |
| French Canadians | 0.1 /100 | #272 | Tragic 6.7% |
| Whites/Caucasians | 0.1 /100 | #273 | Tragic 6.7% |