Immigrants from Fiji vs Mexican Self-Care Disability
COMPARE
Immigrants from Fiji
Mexican
Self-Care Disability
Self-Care Disability Comparison
Immigrants from Fiji
Mexicans
2.8%
SELF-CARE DISABILITY
0.0/ 100
METRIC RATING
300th/ 347
METRIC RANK
2.7%
SELF-CARE DISABILITY
0.1/ 100
METRIC RATING
273rd/ 347
METRIC RANK
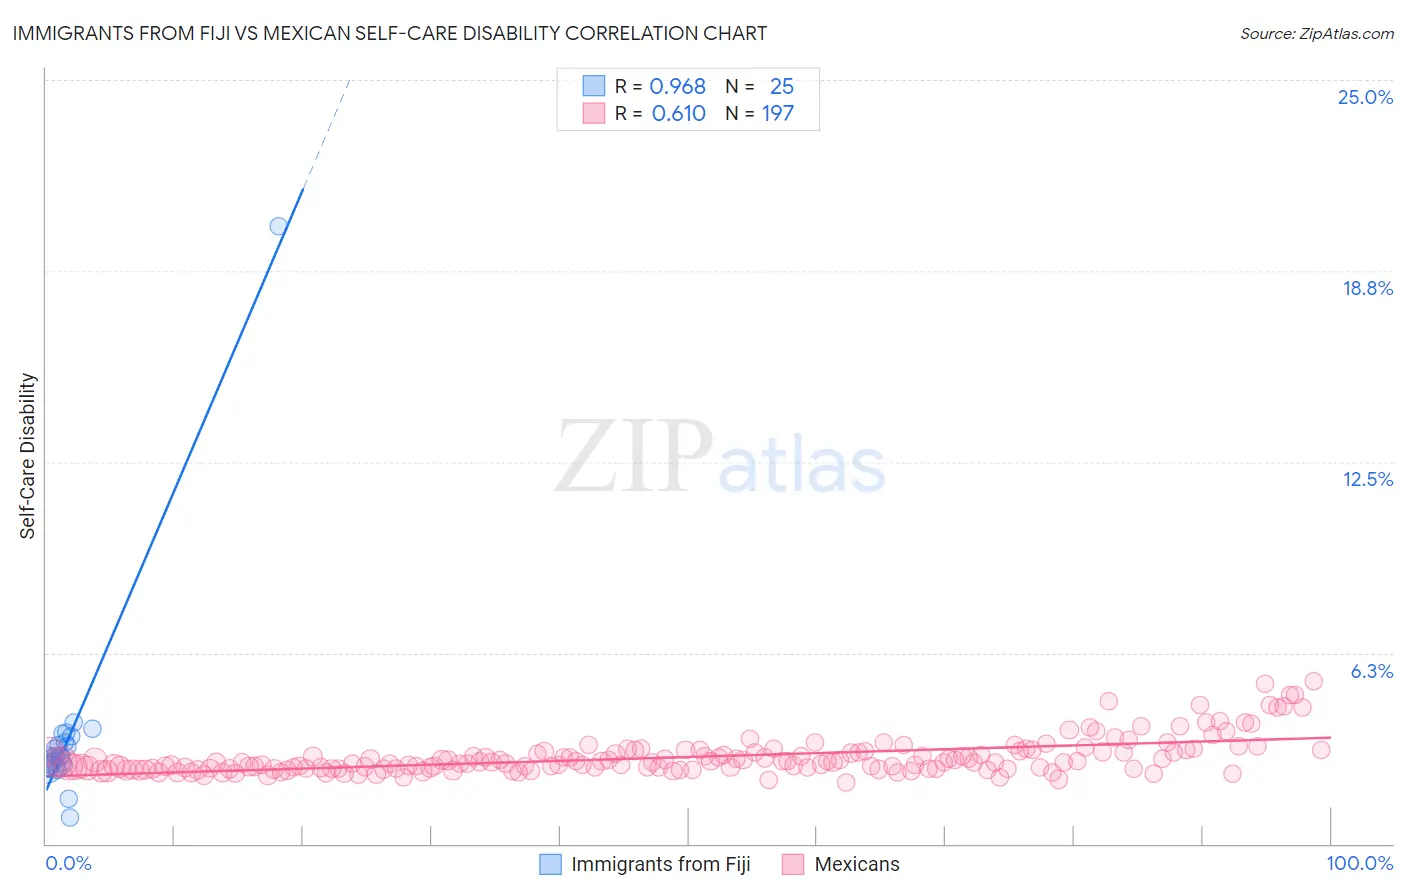
Immigrants from Fiji vs Mexican Self-Care Disability Correlation Chart
The statistical analysis conducted on geographies consisting of 93,753,839 people shows a perfect positive correlation between the proportion of Immigrants from Fiji and percentage of population with self-care disability in the United States with a correlation coefficient (R) of 0.968 and weighted average of 2.8%. Similarly, the statistical analysis conducted on geographies consisting of 563,049,002 people shows a significant positive correlation between the proportion of Mexicans and percentage of population with self-care disability in the United States with a correlation coefficient (R) of 0.610 and weighted average of 2.7%, a difference of 3.8%.
Self-Care Disability Correlation Summary
| Measurement | Immigrants from Fiji | Mexican |
| Minimum | 0.86% | 2.0% |
| Maximum | 20.2% | 5.3% |
| Range | 19.4% | 3.3% |
| Mean | 3.5% | 2.8% |
| Median | 2.9% | 2.7% |
| Interquartile 25% (IQ1) | 2.6% | 2.5% |
| Interquartile 75% (IQ3) | 3.4% | 3.0% |
| Interquartile Range (IQR) | 0.86% | 0.54% |
| Standard Deviation (Sample) | 3.5% | 0.59% |
| Standard Deviation (Population) | 3.5% | 0.59% |
Similar Demographics by Self-Care Disability
Demographics Similar to Immigrants from Fiji by Self-Care Disability
In terms of self-care disability, the demographic groups most similar to Immigrants from Fiji are Pima (2.8%, a difference of 0.090%), Immigrants from St. Vincent and the Grenadines (2.8%, a difference of 0.13%), Immigrants from Belize (2.8%, a difference of 0.28%), Cree (2.8%, a difference of 0.43%), and Immigrants from Guyana (2.8%, a difference of 0.47%).
| Demographics | Rating | Rank | Self-Care Disability |
| Belizeans | 0.0 /100 | #293 | Tragic 2.7% |
| Blackfeet | 0.0 /100 | #294 | Tragic 2.7% |
| Barbadians | 0.0 /100 | #295 | Tragic 2.7% |
| Immigrants | Portugal | 0.0 /100 | #296 | Tragic 2.8% |
| West Indians | 0.0 /100 | #297 | Tragic 2.8% |
| Americans | 0.0 /100 | #298 | Tragic 2.8% |
| Immigrants | Guyana | 0.0 /100 | #299 | Tragic 2.8% |
| Immigrants | Fiji | 0.0 /100 | #300 | Tragic 2.8% |
| Pima | 0.0 /100 | #301 | Tragic 2.8% |
| Immigrants | St. Vincent and the Grenadines | 0.0 /100 | #302 | Tragic 2.8% |
| Immigrants | Belize | 0.0 /100 | #303 | Tragic 2.8% |
| Cree | 0.0 /100 | #304 | Tragic 2.8% |
| Immigrants | West Indies | 0.0 /100 | #305 | Tragic 2.8% |
| Aleuts | 0.0 /100 | #306 | Tragic 2.8% |
| Natives/Alaskans | 0.0 /100 | #307 | Tragic 2.8% |
Demographics Similar to Mexicans by Self-Care Disability
In terms of self-care disability, the demographic groups most similar to Mexicans are Yakama (2.7%, a difference of 0.060%), Immigrants from Trinidad and Tobago (2.7%, a difference of 0.060%), Immigrants from Laos (2.7%, a difference of 0.13%), Trinidadian and Tobagonian (2.7%, a difference of 0.18%), and Japanese (2.7%, a difference of 0.19%).
| Demographics | Rating | Rank | Self-Care Disability |
| Immigrants | Cambodia | 0.1 /100 | #266 | Tragic 2.7% |
| Yaqui | 0.1 /100 | #267 | Tragic 2.7% |
| Immigrants | Mexico | 0.1 /100 | #268 | Tragic 2.7% |
| U.S. Virgin Islanders | 0.1 /100 | #269 | Tragic 2.7% |
| Immigrants | Micronesia | 0.1 /100 | #270 | Tragic 2.7% |
| Trinidadians and Tobagonians | 0.1 /100 | #271 | Tragic 2.7% |
| Immigrants | Laos | 0.1 /100 | #272 | Tragic 2.7% |
| Mexicans | 0.1 /100 | #273 | Tragic 2.7% |
| Yakama | 0.1 /100 | #274 | Tragic 2.7% |
| Immigrants | Trinidad and Tobago | 0.1 /100 | #275 | Tragic 2.7% |
| Japanese | 0.1 /100 | #276 | Tragic 2.7% |
| Immigrants | Ukraine | 0.1 /100 | #277 | Tragic 2.7% |
| Ottawa | 0.1 /100 | #278 | Tragic 2.7% |
| Iroquois | 0.1 /100 | #279 | Tragic 2.7% |
| Hispanics or Latinos | 0.1 /100 | #280 | Tragic 2.7% |